This information applies only to the Ultra Course View.
This information applies only to the Ultra experience.
Course Activity Report
The Course Activity report helps you understand how well your students are performing and how much they are interacting with your course. This report is available in both Ultra courses and in Original courses with Ultra base navigation.
All roles with the privilege to view grades can access the Course Activity report. Turn on the Overall Grade feature to enhance your experience with the Course Activity report. You can:
- Identify struggling students based on their overall grade, missed due dates, the number of hours they spend in your course, and the number of days since their last access
- Message students who are falling behind and encourage them to increase their course activity
- Congratulate students performing well in your course and ask them to be mentors
- Customize your course alerts to identify struggling students when their overall grade drops below a specific value, they've missed due dates, or they haven't accessed the course for a certain number of days
- Download the table view to a CSV (comma-separated values) file to analyze the data with other tools
- Download the scatter plot as a PDF or image to share information with other instructors or mentors of the course
The Overall Grade in Learn Ultra or Learn Ultra Course View is called External Grade in Learn Original.
Topics on this page include:
Access the Course Activity report
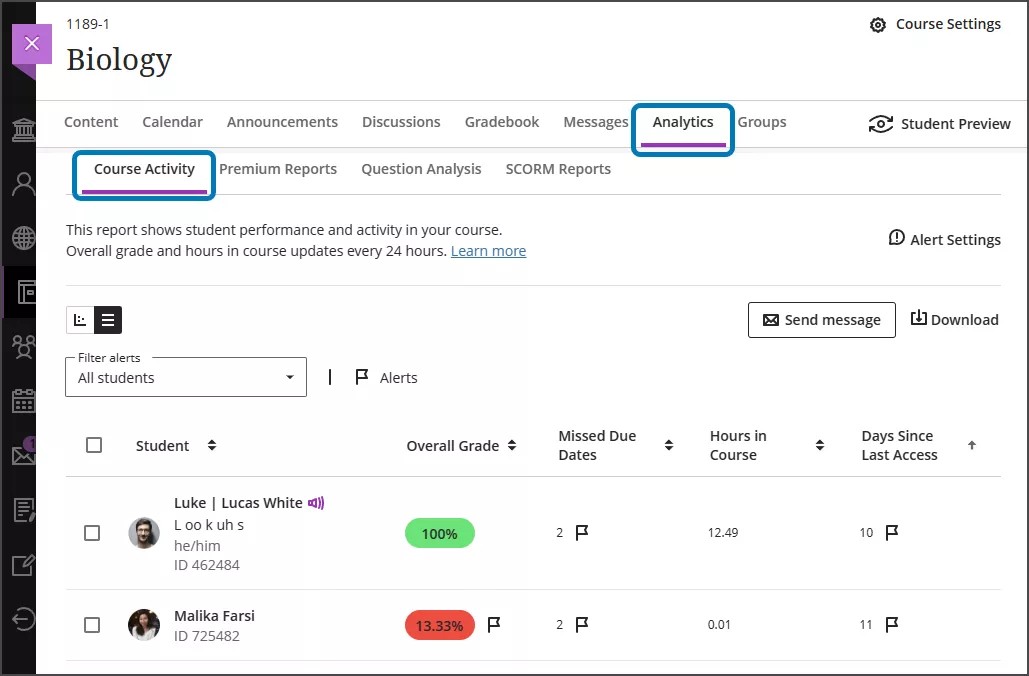
Select Course Activity in your course's Analytics tab.
You can also access the report in the Grades section of the base navigation. Select the pie chart button next to a course.
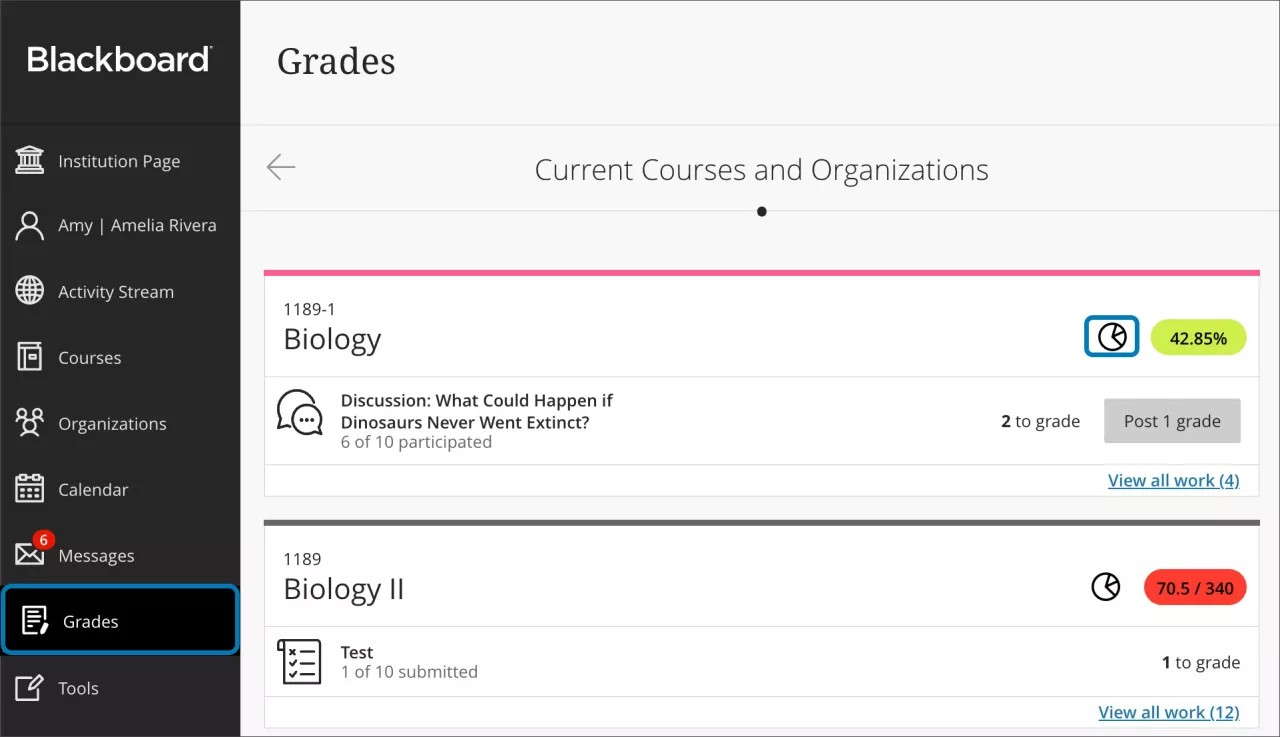
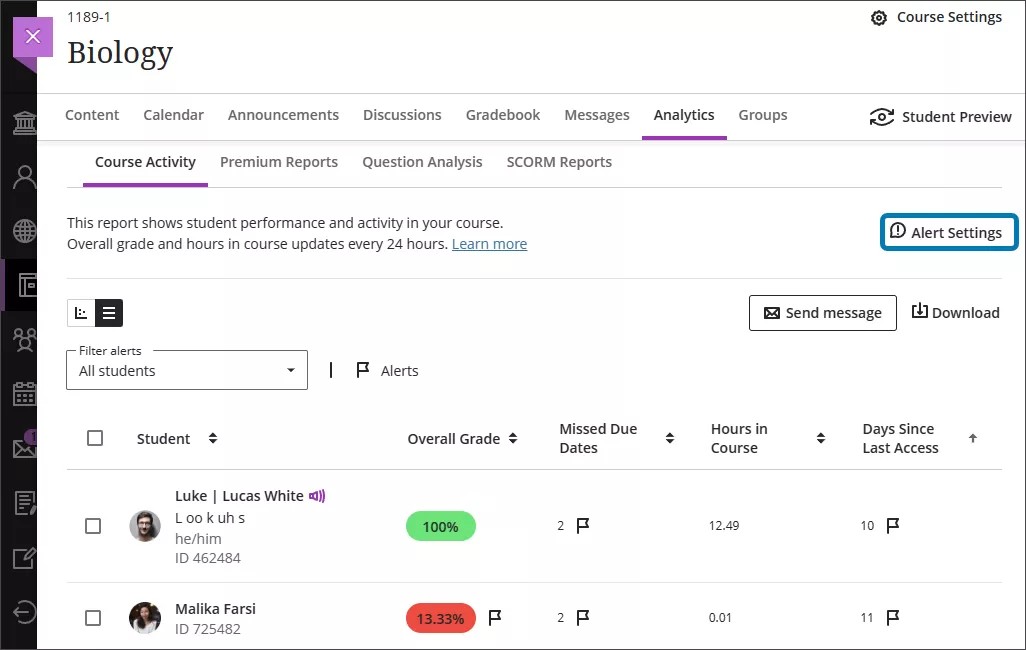
Table view
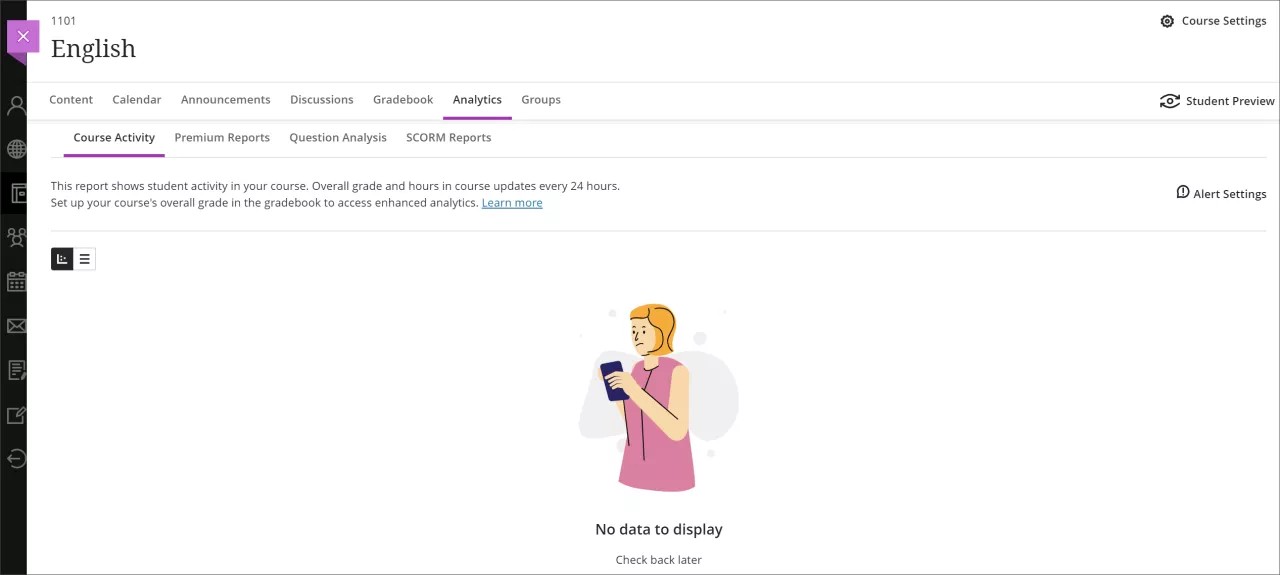
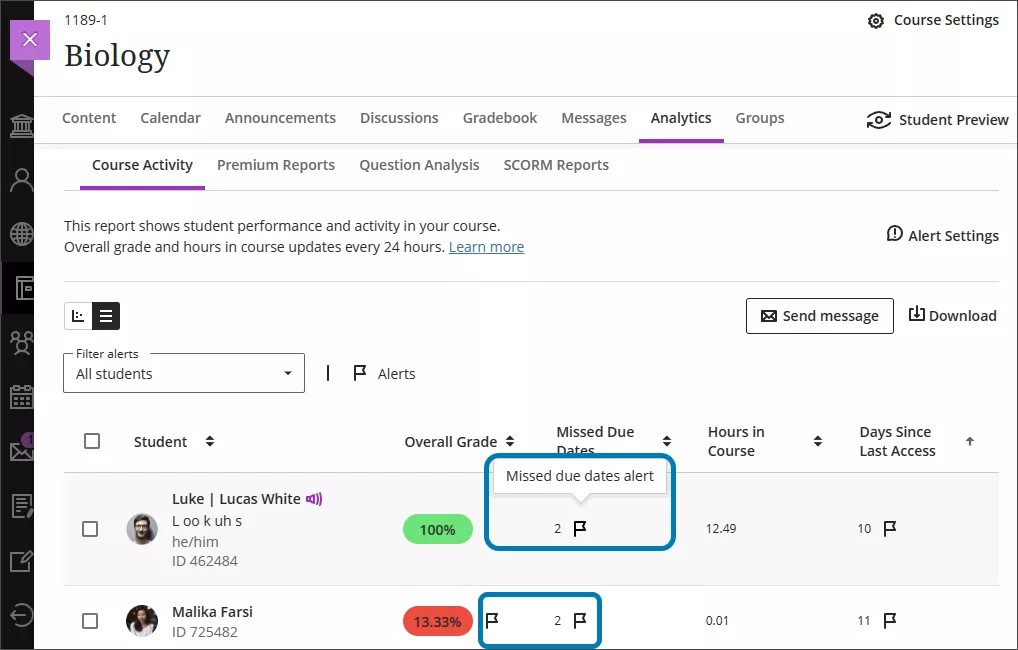
After students have interacted with the course and the report has data to display, you can use the table view.
You might see the table differently depending on settings, student activity in the course, and the data gathered in the course.
- Student: Student's first and last name. Additional student information is shown if available: accommodations, additional name, name pronunciation recording, pronunciation description, pronouns, and Student ID.
- Overall Grade: A student's overall grade in the course. If the overall grade column is not turned on or if there is no graded material, this column won't display information. This column is updated every 24 hours in the early morning, so the overall grade in the report might not match what is currently in the gradebook.
- Missed Due Dates: counts the number of activities a student has not completed before the established due date, including assessments, graded discussions, and graded journals. Your institution can choose whether or not to include information on missed due dates in the Course Activity report. Visit the "About Missed Due Dates counts" section on this page to learn more about how missed due dates are counted.
- Hours in Course: Number of hours a student has been active in your course. Hours in course are counted from the time students select something within the course to when students select something outside the course. If a student is logged out from their course session, only the time before their last action within the course is counted. This column is updated every 24 hours in the early morning.
- Days Since Last Access: Counts the days since a student last accessed a course. Each time a student accesses the course, the count of days since last access changes to 0. If a student has never accessed the course, days since last access are null and “--” is displayed.
There are some limits on the report.
- The report has a limit of 3000 students. For larger courses, only 3000 students will be displayed.
- Missed due dates are not calculated for courses with over 3000 students. Only a null value of "--" is displayed.
- When there are no students enrolled in the course, the table is not available.
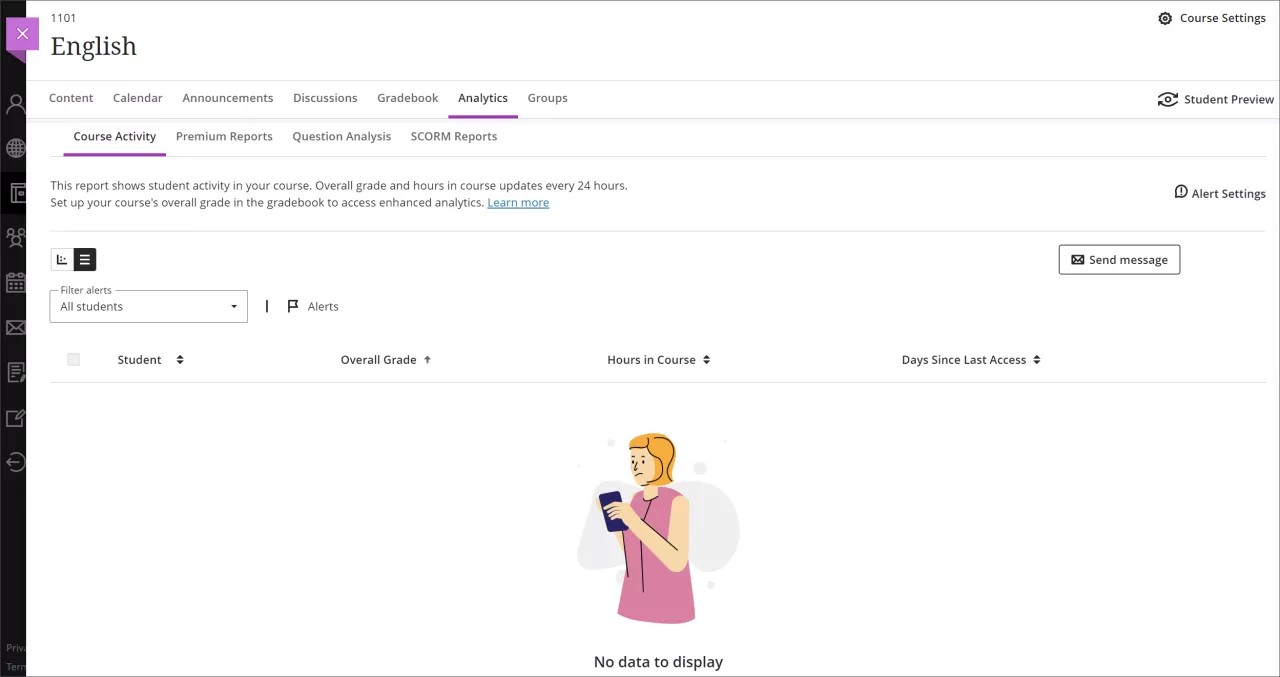
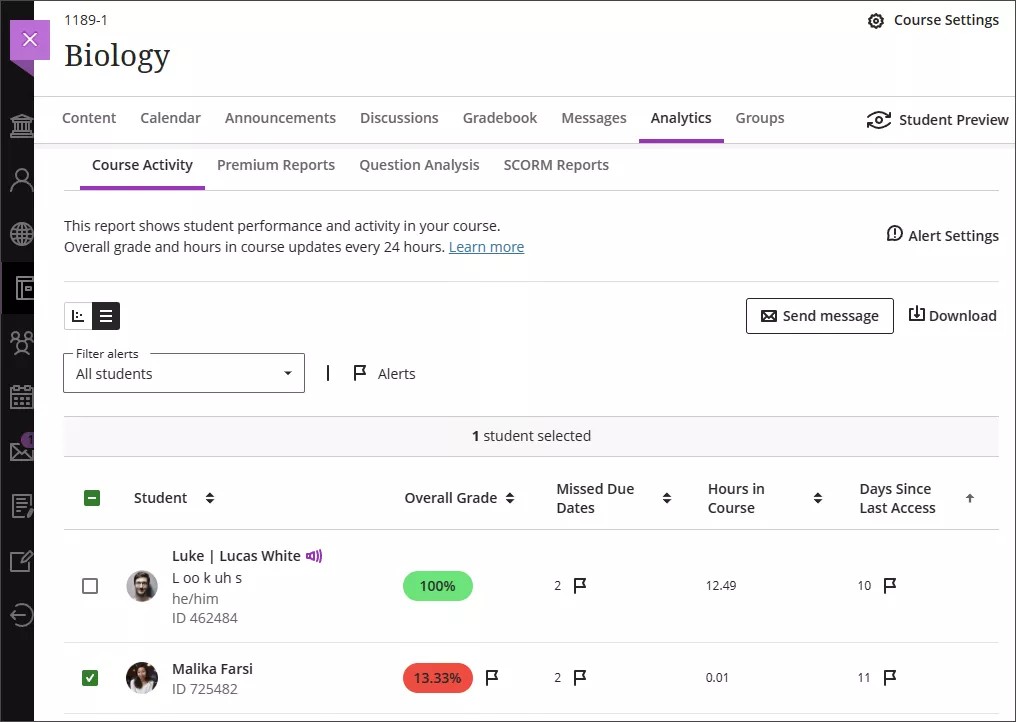
Table options
- You can choose students and send them messages by selecting the Send message button. When you send a message to multiple students, each student will receive an individual message and will not know which other students were included.
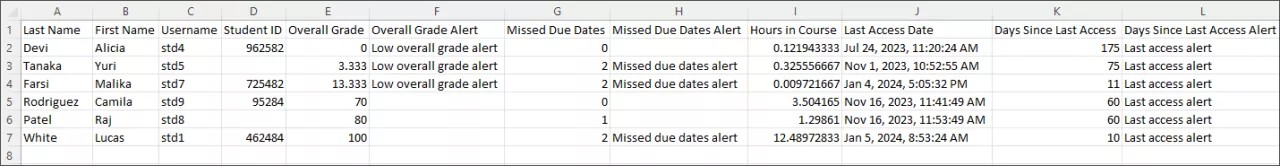
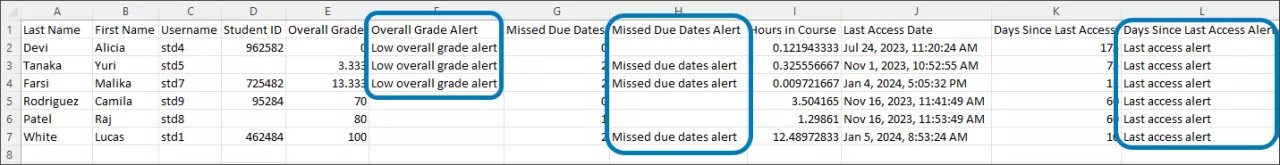
- Select the Download button to download the table as a CSV. The exported file contains the following columns:
- Last Name
- First Name
- Username
- Student ID
- Overall Grade
- Overall Grade Alert
- Missed Due Dates
- Missed Due Dates Alert
- Hours in Course
- Last Access Date
- Days of Inactivity
- Days Since Last Access Alert
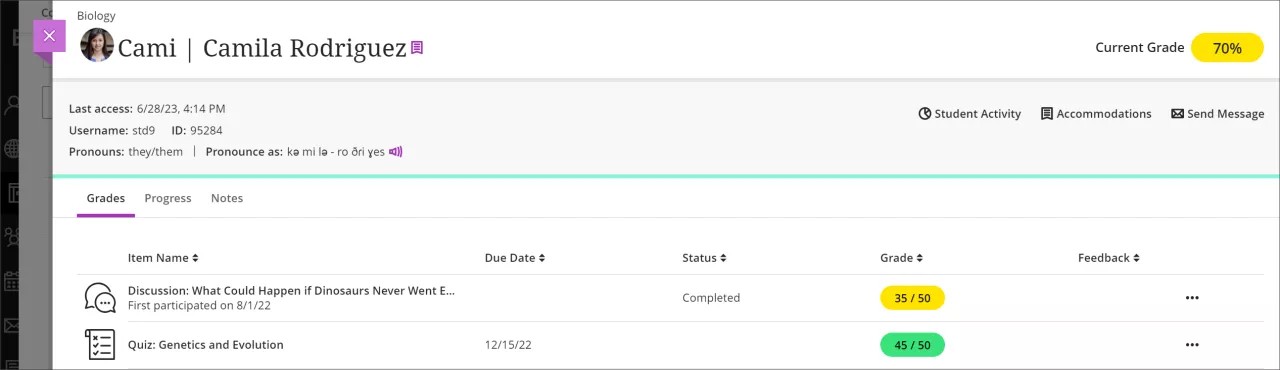
- Select a student on the table to bring up the Student Overview to check the student’s additional information, grades, progress, and more. Visit the "Student Overview" topic for more information.
Scatter plot
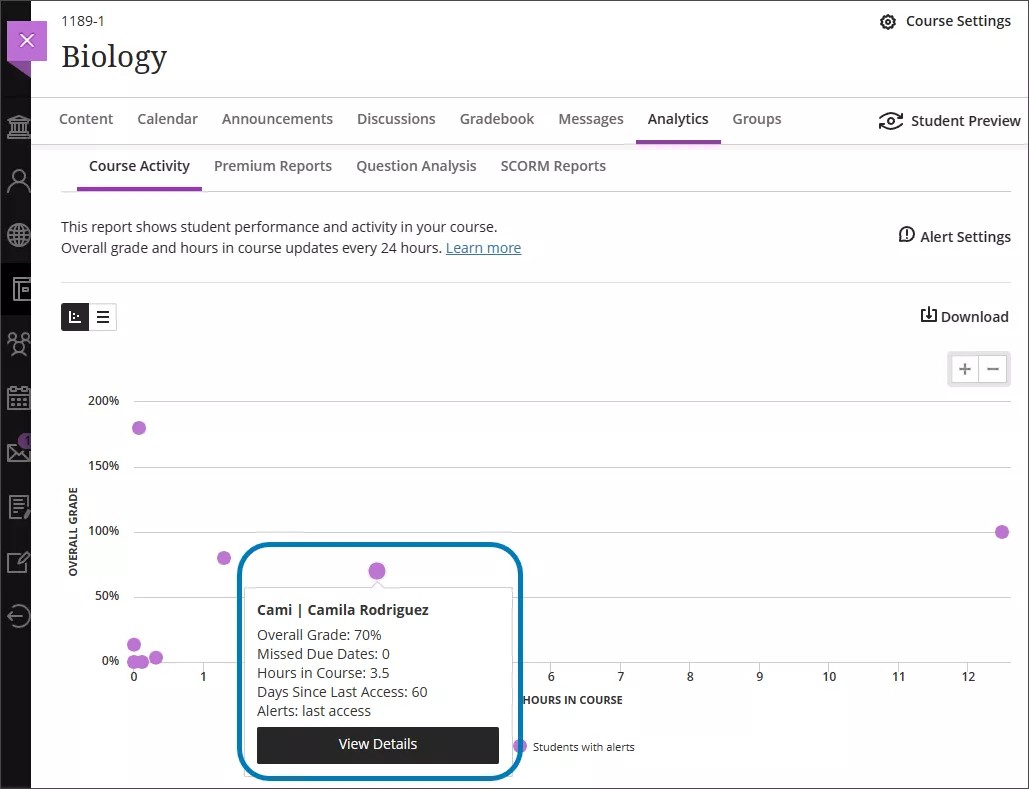
The scatter plot's Y axis represents the students' overall grades and the scatter plot's X axis represents the students' number of hours in the course. You have a broad view of your students' performance in relation to each other and their activity levels. The data shown is updated every 24 hours in the early morning. You can access the scatter plot through the Course Activity tab or by selecting an alert notification on your activity stream.
Note: The scatter plot is not compatible with screenreaders.
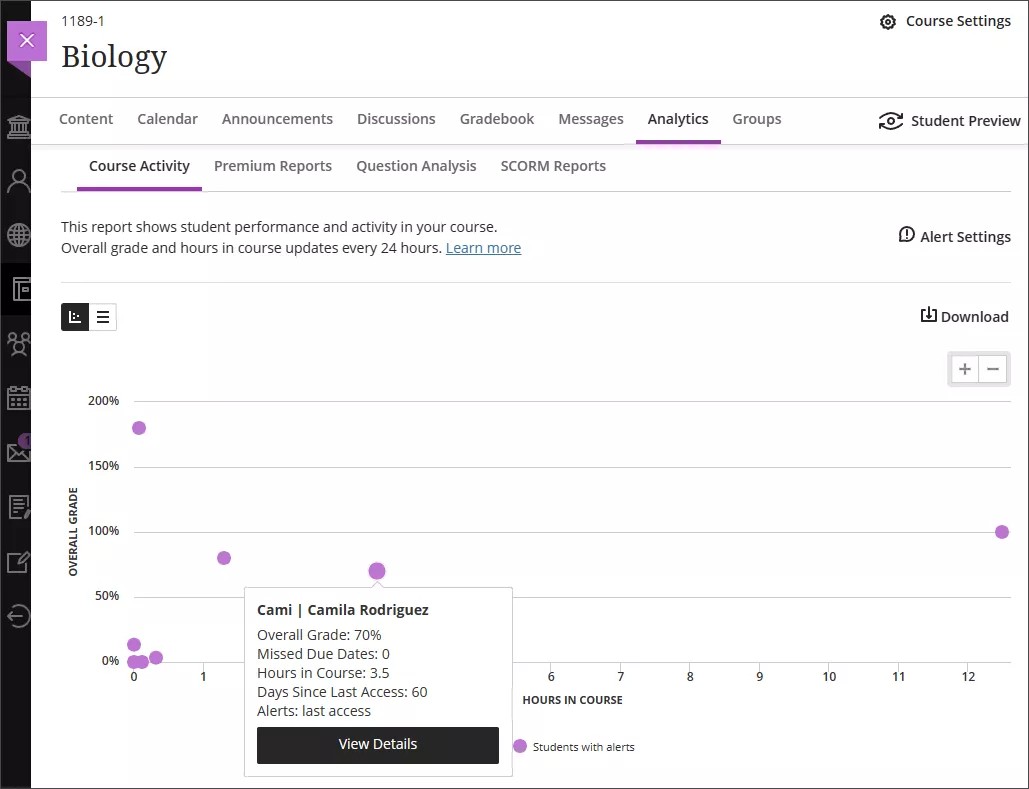
Each dot represents a student. Students who spend more hours in the course tend to have higher grades. You can:
- Zoom in or out by selecting the + and – icons at the top right. To focus on a specific region, select somewhere on the chart and drag to zoom in.
- Identify visually odd trends, such as students with low grades who are spending a lot of time in the course or high performing students.
- Select a dot to display the student's name, overall grade, missed due dates, hours in course, days of inactivity, and alerts. Hours in course are counted from the time students select something within the course to when students select something outside the course. If a student is logged out from their course session, only the time before their last action within the course is counted.
- Purple dots indicate students with at least one alert. An alerts section displays the applicable alerts for the student.
- Select View Details to bring up the student's activity details report to check the student's progress on a weekly basis. Visit the "Student Activity Details Report" topic for more information.
- Select the Download button to download the scatter plot as a PDF or image file. The scatter plot can be shared with other instructors, academic staff, or mentors of the class.
There are some limits on the report.
- The report has a limit of 3000 students. For larger courses, only 3000 students will be displayed.
- Missed due dates are not calculated for courses with over 3000 students. Only a null value of "--" is displayed.
- When there are no students enrolled in the course, the scatter plot is not available.
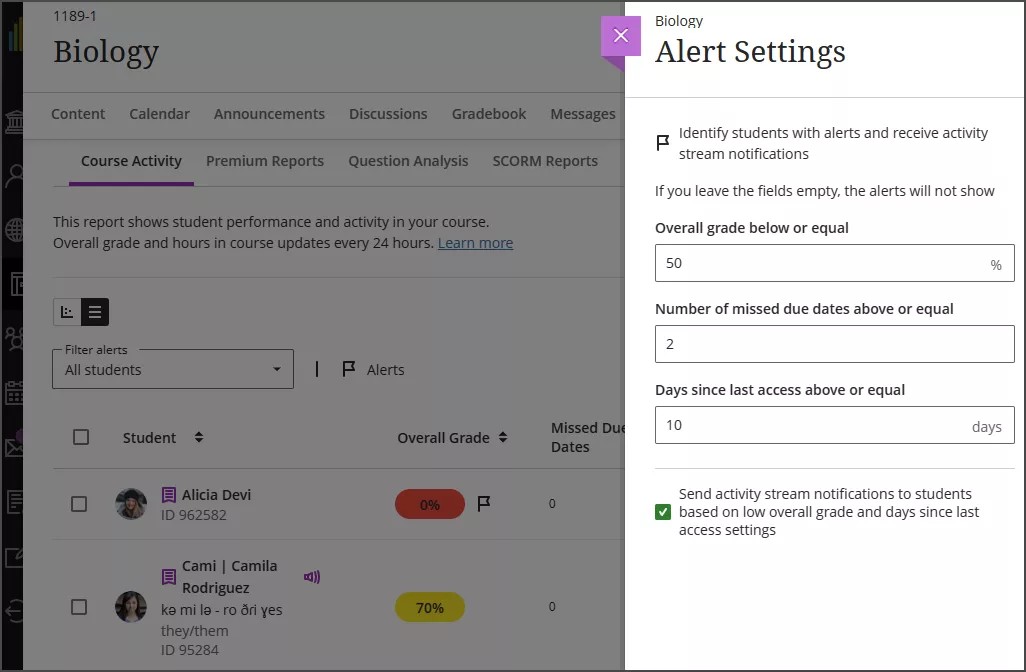
Alert settings
You can customize your alerts to fit your teaching style on the Course Activity report:
- Select Alert Settings on the Course Activity report to open the alert settings panel.
- You can customize what alerts you receive on your activity stream. You can also select whether or not students will receive alerts based on your low overall grade and days since last access settings.
Students will not receive notifications based on course missed due dates alert settings. If a student opts in to missed due dates alerts, alerts are sent for each content item.
- You can also adjust alerts in the Student Performance section of the Gradebook settings. Open the settings panel by selecting the Settings button at the top of the Gradebook.
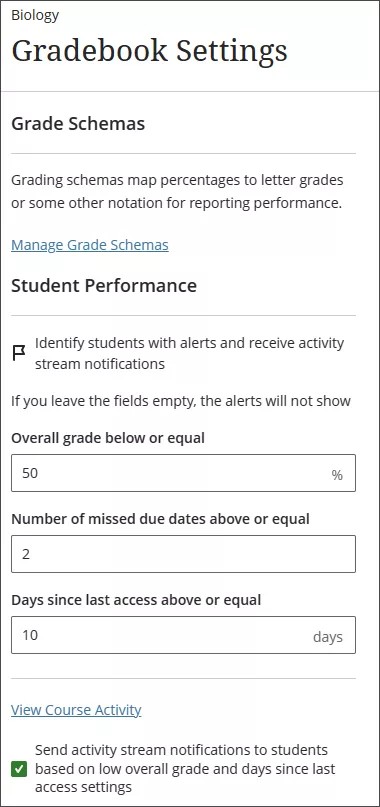
You'll receive activity stream notifications based on your settings:
- When a student's overall grade is below or equal a certain percentage
- If a student's number of missed due dates is above or equal a certain amount
- If a student's days since last access are above or equal a certain amount
Alerts for days since last access are set to 15 days of student inactivity by default, but you can adjust alerts for each course.
There are no default settings for sending alerts for overall grade or missed due dates.
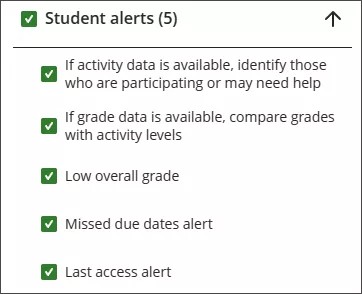
You can turn other kinds of notifications off or on in your activity stream settings. Select or deselect the boxes under Student alerts to adjust the alerts related to the Course Activity report. The checkbox to the left of Student alerts applies your settings to all notifications. Open this panel by selecting the Settings button at the top of the activity stream page.
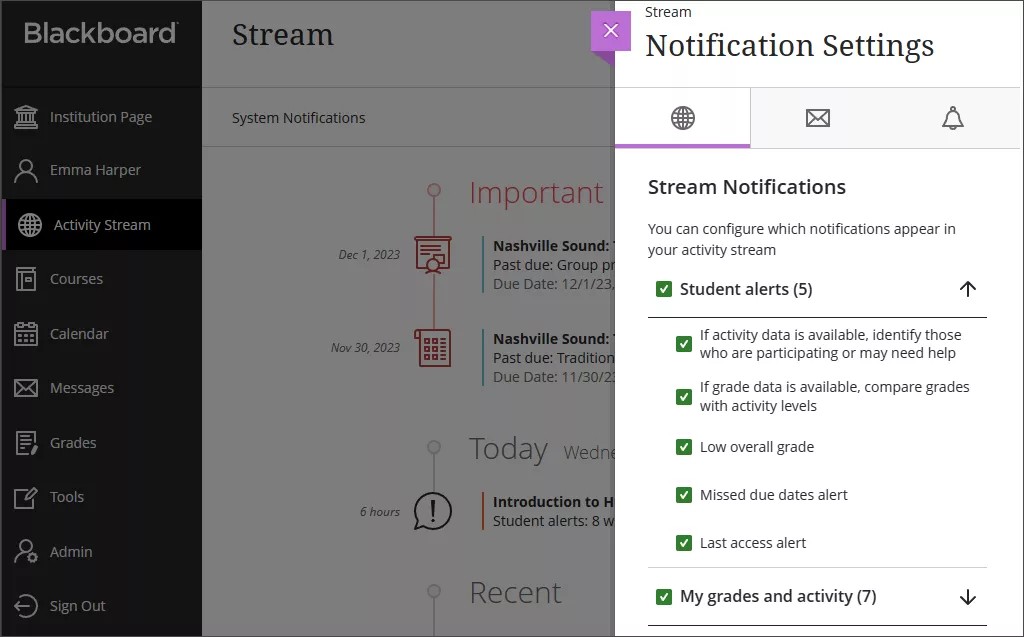
Some alerts require a minimum amount of data before you'll receive alerts. These alerts are:
- If there is enough activity data, identify those who are participating or may need help
- If there is enough grade data, compare grades with activity levels
For these alerts to be sent, at least 50% of students must have at least one graded item and the specific student needs to have at least thirty minutes of activity over the past week.
Other performance alerts include:
- Low overall grade
- Missed due dates alert
- Last access alert
Selecting any of these alerts means that you'll receive an alert every time a new student meets your alert conditions.
For administrators: To view the Course Activity and Student Activity Details reports, the user’s role needs to have the “Course/Organization Control Panel (Grade Center) > View Grades” privilege. You can control alerts for Student Last Access, Student Low Overall Grade, and Student Missed Due Dates at the institutional level through Notification Settings in the administrator panel.
Alert flags
Students with alerts are highlighted with flags in the Course Activity report. You can identify students at risk, even within larger courses.
Table view
In the table view, flags are next to students who meet alert conditions you’ve set for overall grade, missed due dates, and days since last access. You can hover over a flag to view the alert type.
You can filter the student list by alerts and focus on students who need more attention and message them if needed. There are three filter options:
- All students
- Students with alerts
- Students without alerts
In the CSV download, low overall grade, missed due dates, and last access alert columns indicate when a student has an alert.
Scatter plot
In the scatter plot, students who have at least one alert are displayed as a purple dot. Select the dot for more information on the student. An alerts section lists all of the alerts the selected student has.
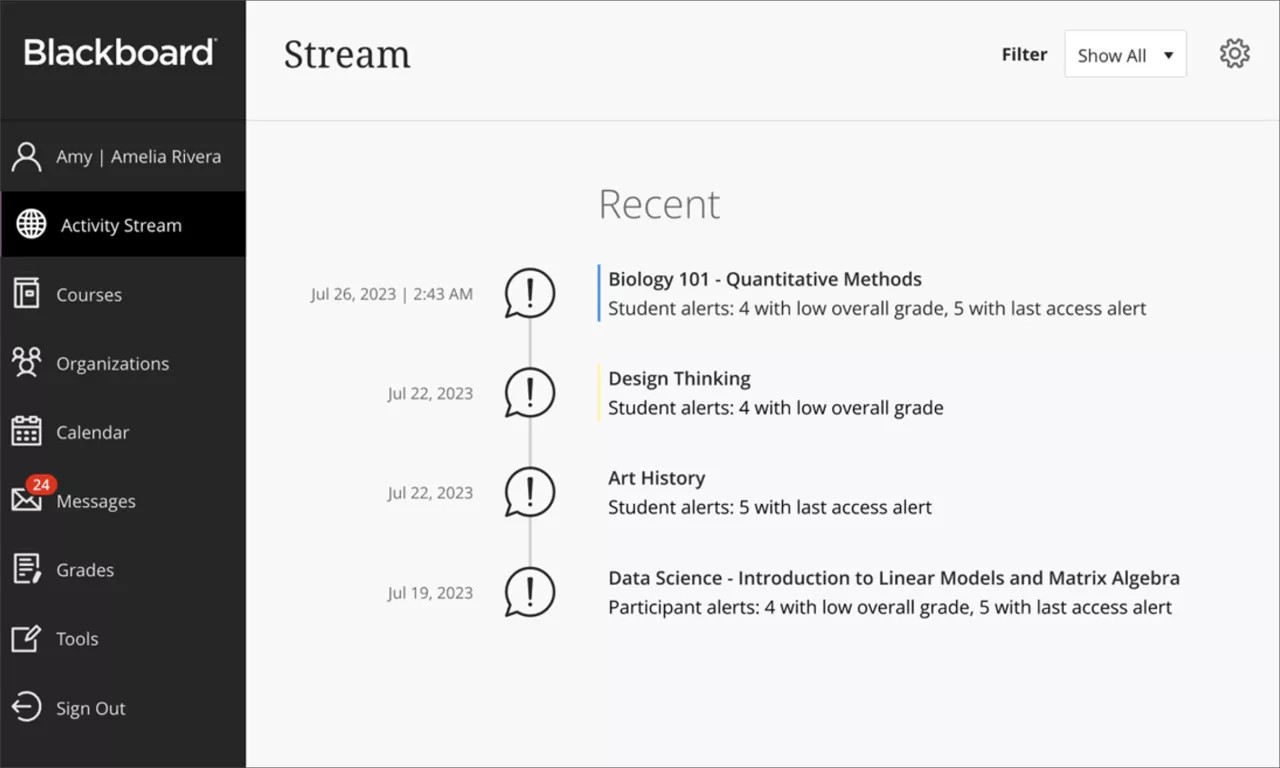
Activity stream
There's a summary of student alerts in your activity stream. You can view how many students have an alert for low overall grade, missed due dates, or days since last access.
The table below is for administrators and instructors. The table maps system settings to activity stream setting, with rules for triggering the alert.
| Admin Notification Setting | Activity Stream Setting | Rules |
|---|---|---|
| Student Activity Available | If activity data is available, identify those who are participating or may need help | For these alerts to be sent, at least 50% of students enrolled in a course must have at least one graded item and the median activity for students in the course needs to be at least thirty minutes over the past week. |
| Student Grade Data Available | If grade data is available, compare grades with activity levels | For these alerts to be sent, at least 50% of students enrolled in a course must have at least one graded item and the median activity for students in the course needs to be at least thirty minutes over the past week. |
| Student Last Access Alert for Instructors | Last access alert | Alerts for student lass access are set to below or equal a certain amount of days you set. The days since last access alert is set to 15 days of student inactivity by default, but you can adjust alerts for each course. |
| Student Low Overall Grade Alert for Instructors | Low overall grade | Alerts for overall grade are set to below or equal a certain percentage that you set. There's no default setting for low overall grade alerts. |
| Students Missed Due Dates Alert for Instructors | Missed due dates alert | Visit the "Missed due dates counts" topic for detailed rules for this alert. There is no default setting for missed due dates alerts. |
If you select the notification, you're directed to the Course Activity report. The report is already filtered to students with alerts.
The summary of student alerts in the activity stream are only available for courses with at least 10 and up to 2000 students. Courses with enrollment outside of that range won’t receive notifications. No alerts will appear on the activity stream until there have been at least two weeks of activity in the course.
For administrators: This feature is available for all courses. There are no configurations needed.
About Missed Due Dates counts
Missed due dates counts allow you to know if your students are submitting their work on time. Students who match your settings for the missed due dates count appear in the Course Activity report’s table and scatter plot, downloaded CSV file, and your activity stream. You’ll receive activity stream notifications for new students matching the missed due counts alert every day.
Missed due dates are counted when a student doesn't submit before the due date in the following circumstances:
- Assessments, including group and formative
- Assessments with the “Collect submissions offline” option selected - when you create an attempt and enter the submission date and time after the due date
- Assessments with the “Hide student names” option selected – you’ll receive alerts only after all student submissions are graded and student names are unhidden
- Discussions and journals that are graded SCORM packages with the “Grade individual SCOs” option is selected in SCORM settings
- Other 3rd party features, such as LTI and Respondus
Exceptions to the missed due date counts:
- Students with a due date accommodation will never have their work marked late.
- Students with a due date exception will have a missed due date only if the due date exception passes and there is no submission.
- Students with an exemption never have their work marked late. A student with an exemption won't have any missed due dates in the exempted activity.
- Hidden content with a due date or content with date, time, or performance release conditions are included in missed due dates counts.
- Content with a due date and release conditions for individual course members or groups will count a missed due date only for those students or groups included in the condition who miss the due date.
- New items added to the gradebook with a due date are not included in the missed due dates counts.
For administrators: A configuration option for missed due dates counts is in Administrator Panel that’s called “Missed due dates metric and alert included in the Course Activity report.” The default state is on. If the missed due dates option is set to off, the Course Activity report still displays students’ overall grade, hours in course, and days since last access.