This information applies only to the Ultra Course View.
This information applies only to the Ultra experience.
The Student Activity Details Report for Courses
The report provides you with analytics for your students’ performance in your course. You can view a student’s hours in course and changes in overall grade from week to week. The report makes it easy to see when a student’s hours in course drops or if a student begins to earn lower grades. Report data is updated every 24 hours in the early morning.
You can use the report to guide and inform your instruction in many ways.
- Identify struggling students, students who are improving over time, or students whose grades start trending downwards
- Message students who are falling behind and encourage them to increase their course activity
- Congratulate students performing well in your course and ask them to be mentors
- Set up an appointment with all students in the course to follow-up on strategies to improve student performance and activity
- Download the table view to a CSV (comma-separated values) file to analyze the data with other tools or share student reports to other faculty members if needed
- Download the line charts as a PDF or image to share information with other instructors or mentors of the course
The Overall Grade in Learn Ultra or Learn Ultra Course View is called External Grade in Learn Original.
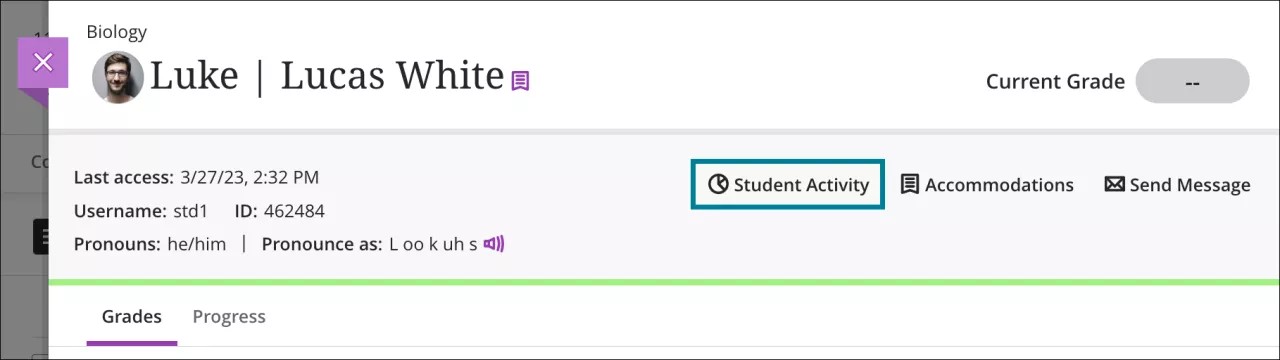
Access the Student Activity Details report
Select the Student Activity icon in the Student Overview. Visit the “Student Overview” topic for more information about the feature and how to access it.
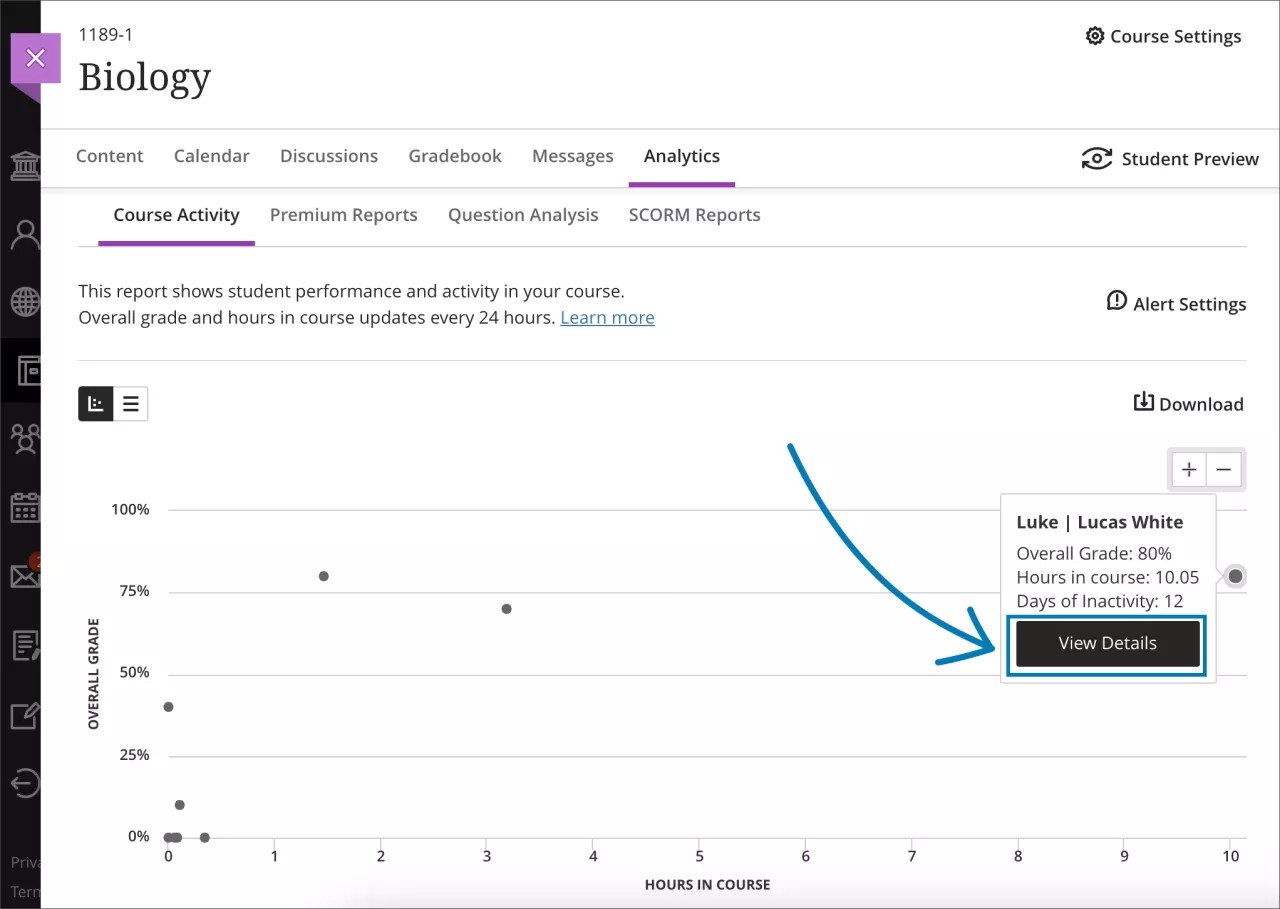
You can also select the View Details button in the Course Activity report’s scatter plot. Visit the “Course Activity Report” topic for more information about the feature and how to access it.
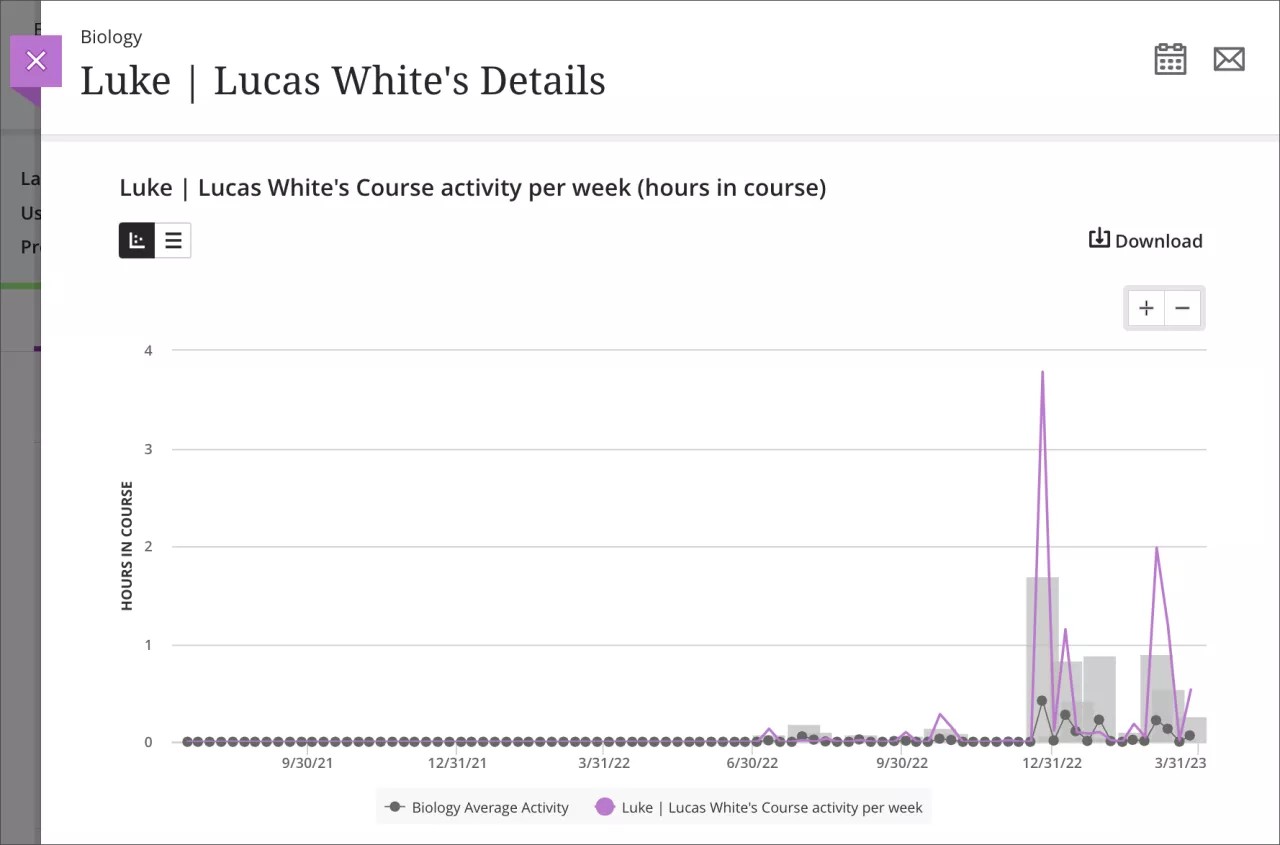
Course activity per week
Table view
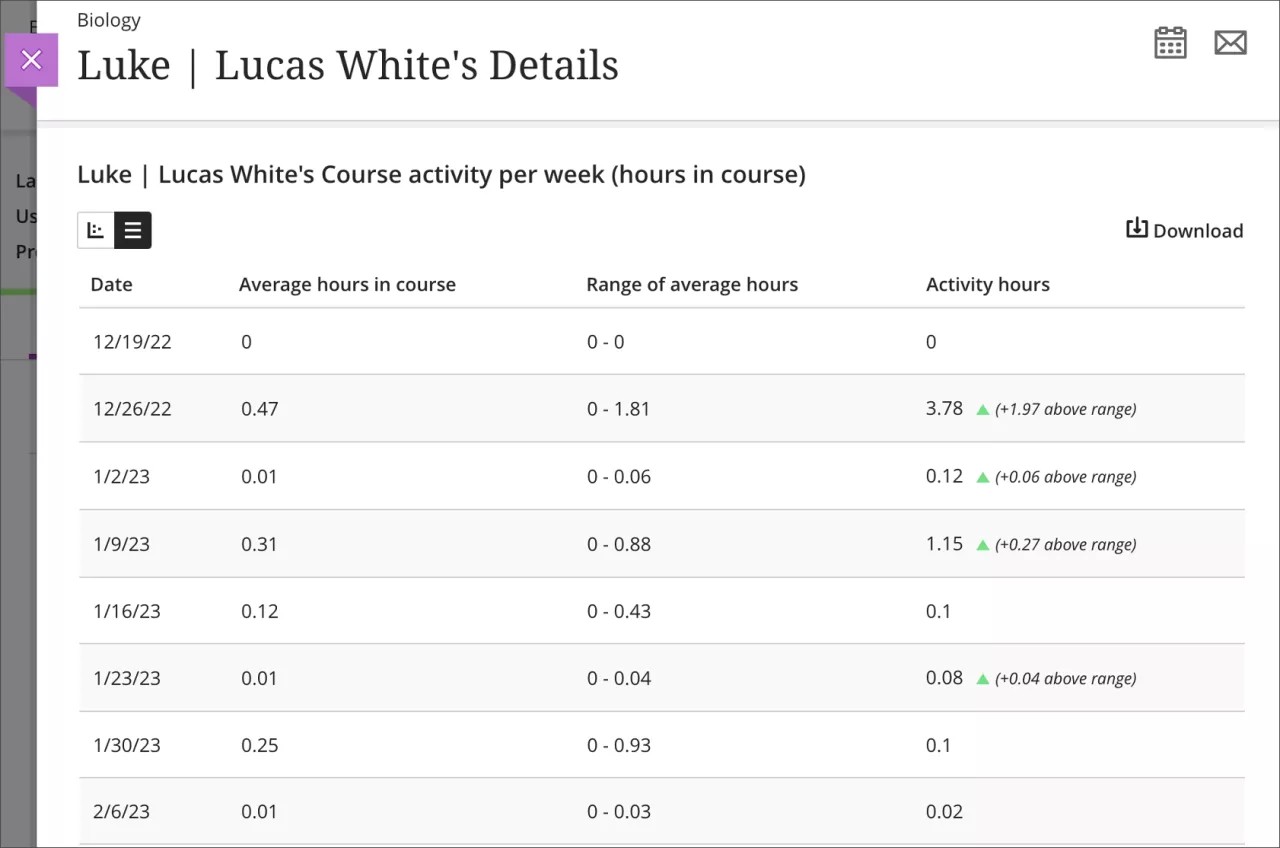
The table view of the Student Activity Details report has four columns: Date, Average hours in course, Range of average hours, and Activity hours. Data is presented in rows organized by week. Each week begins on Monday and the table is organized in descending order from the first to the most recent week.
- Average hours in course are the average hours in a course spent by all students per week.
- Range of average hours are the average hours in a course spent by all students per week, plus or minus the standard deviation. You can use the range of hours as additional information about whether the Average hours in course column has a high or low standard deviation.
- Activity hours are the hours in a course accumulated by a student per week. Hours in course are counted from the time students select something within the course to when students select something outside the course. If a student is logged out from their course session, only the time before their last action within the course is counted.
- Select the Download button to download the table as a CSV (comma-separated values) file.
Line chart
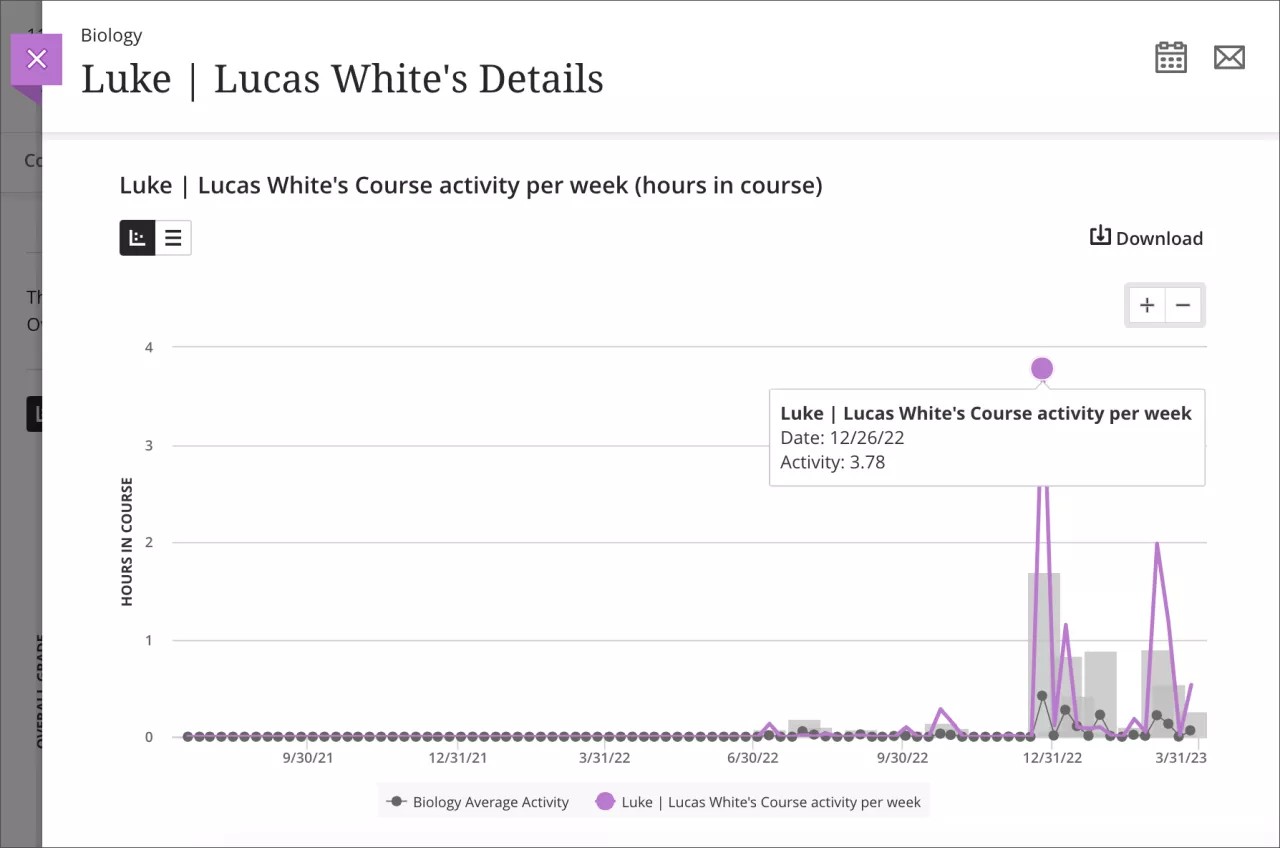
The line chart provides you with a graphical representation of a student’s hours in course per week in comparison to other students in the course.
The selected student’s activity displays in purple and average course activity is in gray.
- Select a dot to see exact dates and hours in course for a student or the course average.
- Zoom in or out by selecting the + and – icons at the top right. To focus on a specific region, select somewhere on the chart and drag to zoom in.
- Activity per week is counted from the time students select something within the course to when students select something outside the course. If a student is logged out from their course session, only the time before their last action within the course is counted.
- Select the Download button to download the line chart as an image or PDF file.
Overall Grade
Table view
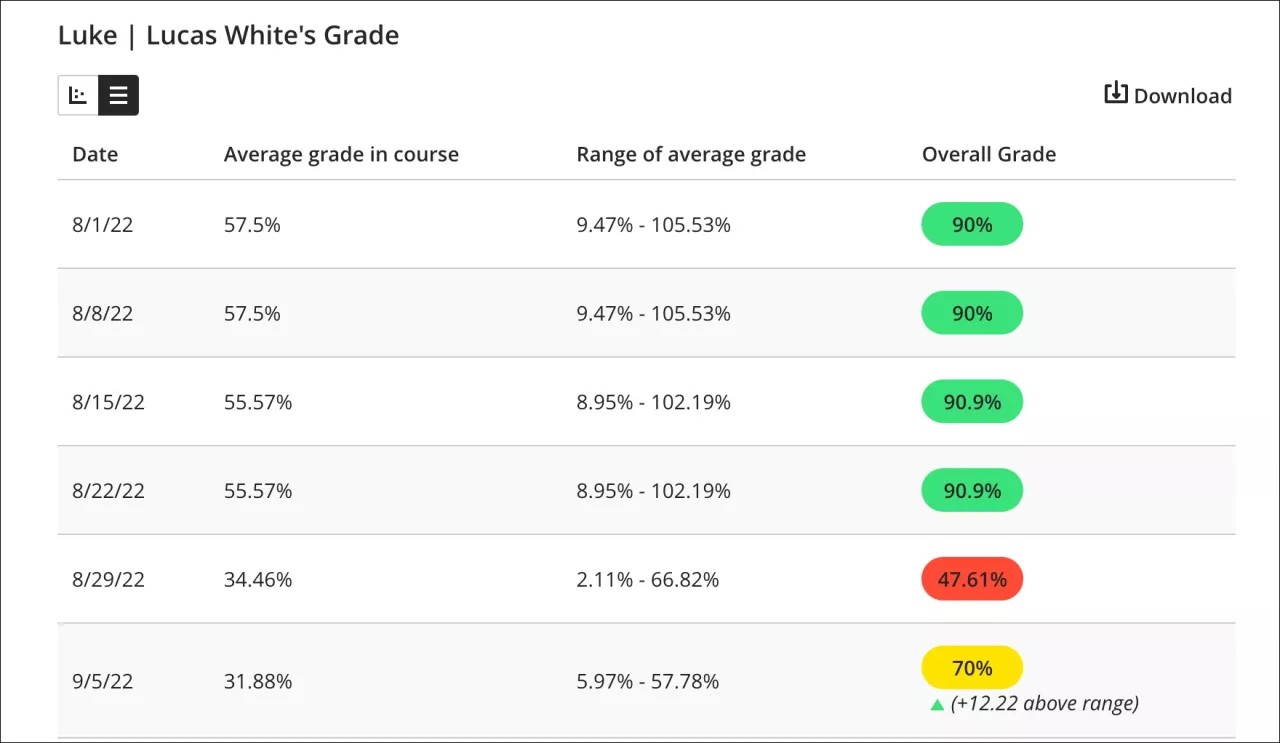
The table view has four columns: Date, Average grade in course, Range of average grade, and Overall Grade. Data is presented in rows organized by week. Each week begins on Monday.
- Average grade in course is the average overall grade for all students in a course per week.
- Range of average grade is the average overall grade for all students in a course per week, plus or minus the standard deviation. You can use the range of overall grades as additional information about whether the Average grade in course column has a high or low standard deviation.
- Overall Grade is the overall grade of a student in the course per week.
- Select the Download button to download the table as a CSV (comma-separated values) file.
For example, the fourth row in the table provided above displays overall grades for the week of August 15, 2022 to August 22, 2022 in a Biology course. All students in the Biology course had an average overall grade of 55.57%. In comparison, Lucas White had an above average overall grade of 90.9%.
In the following week of August 22, 2022 to August 29, 2022, all students in the Biology course had an average overall grade of 34.46%. Lucas White’s overall grade is 47.61%. The table displays the course average and shows how Lucas's performance dropped in comparison to the class’s grade.
When a course doesn't have the overall grade set up, the table is not displayed. Visit the "Grade Columns" topic to see how to set up the overall grade.
Line chart
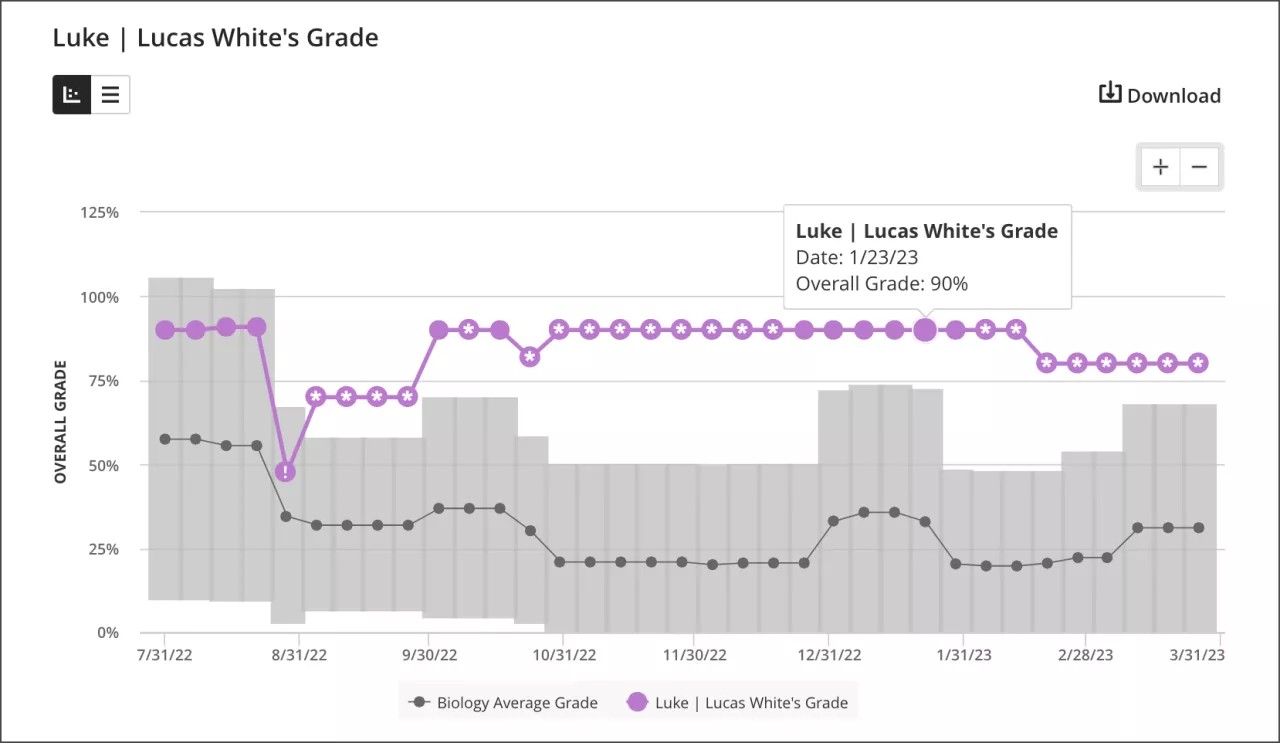
The line chart provides you with a graphical representation of a student’s overall grade over time in comparison to other students in the course.
- The selected student’s grade displays in purple and course average grade is in gray.
- Select a dot to see exact dates and grades for a student or the course average.
- Zoom in or out by selecting the + and – icons at the top right. To focus on a specific region, select somewhere on the chart and drag to zoom in.
- Select the Download button to download the line chart as an image or PDF file.
When a course doesn't have the overall grade set up, the line chart is not displayed. Visit the "Grade Columns" topic to see how to set up the overall grade.