Find out more about Anthology Illuminate
-
Data Q&A is one of our Anthology Illuminate Enhanced features.
Explore your institutional data by asking questions from a wide set of topics related to critical aspects of the student experience and get customizable visual answers. You can quickly identify trends and patterns in your data and easily share your insights with others.
With Data Q&A you can:
- Answer questions about the institution’s data using semantic-based advanced data exploration.
- Present answers to those questions in a meaningful way using various visualization tools.
- Pin visuals of frequently asked questions in personalized dashboards for quick access.
- Access advanced filtering options, forecasting, and prescriptive questions.
- Ask questions and get answers depending on the user’s institutional hierarchy and role.
What type of questions to ask:
Note that Data Q&A is only available in English.
Questions that help leverage great insights from your institutional data, you can ask about:
- Student activity trends
- Student comparisons with course peers
- Student engagement with courses
- Student performance
You can also get inspiration by one of these sample questions:
- Which students' grades are failing?
- What’s the student’s average grades in each course in comparison to their peers?
- What are the average hours spent in a course weekly per course per student?
- Which students did not access their courses in the last 3 weeks?
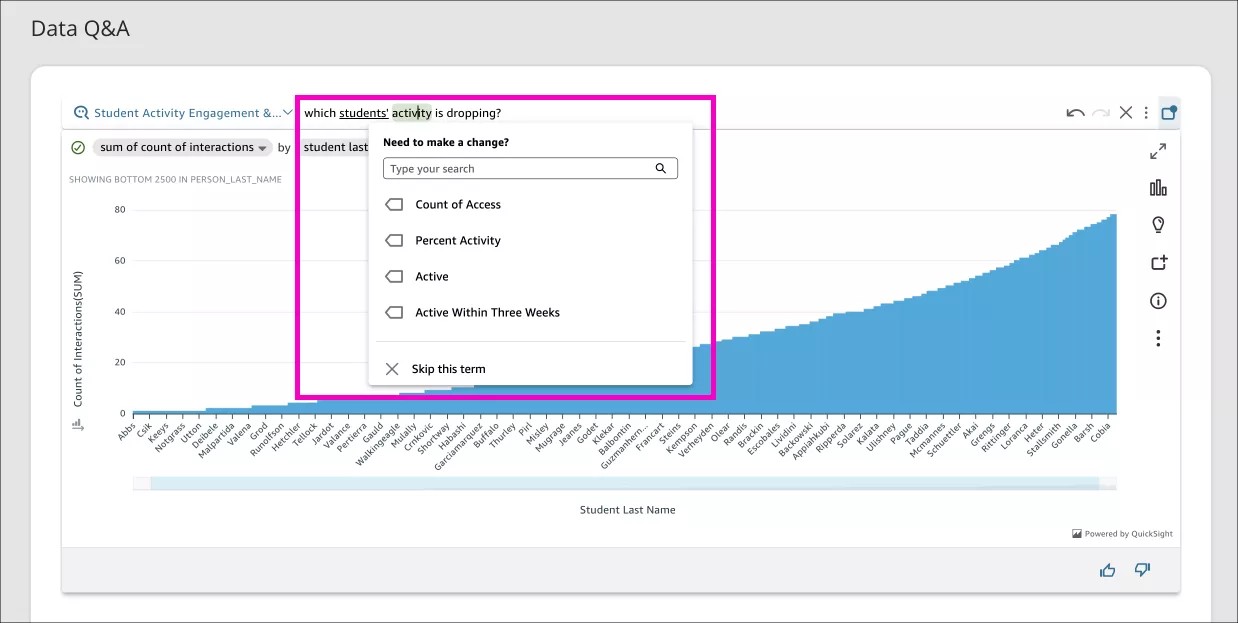
- Which students' activity is dropping?
- Which students have minimum engagement?
- What proportion of students have grades at or above, and below the grade boundary?
- How’s the student activity and performance in each course compared to peers?
- What’s the student’s participation rate compared to peers?
- What's the level of engagement with course content per student?
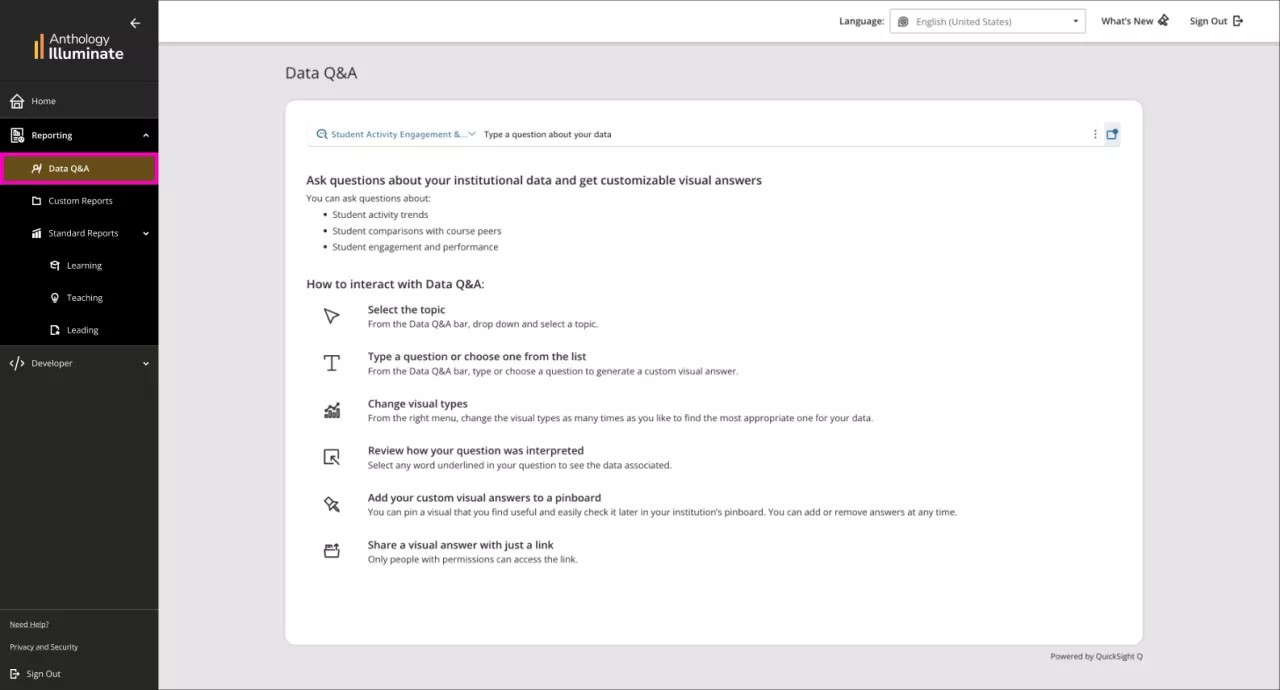
How to interact with Data Q&A:
- Select the topic
From the Data Q&A bar, drop-down and select the topic available that you would like to ask about. You’ll notice that the sample topic Student Engagement & Performance is already selected for you.
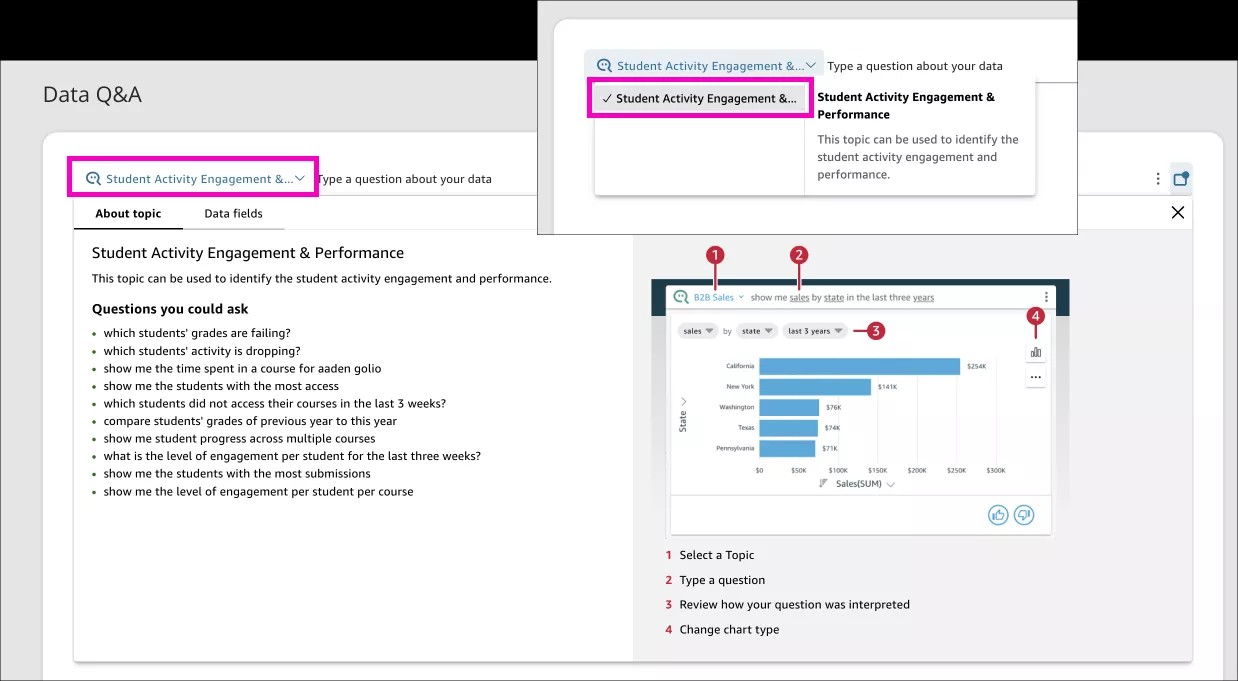
- Type a question
From the Data Q&A bar, type your question to generate a custom visual answer.

- Review how your question was interpreted
Below your question, you can find a description of the visualization. Or you can select any underlined term to see the data that was associated with each of them.
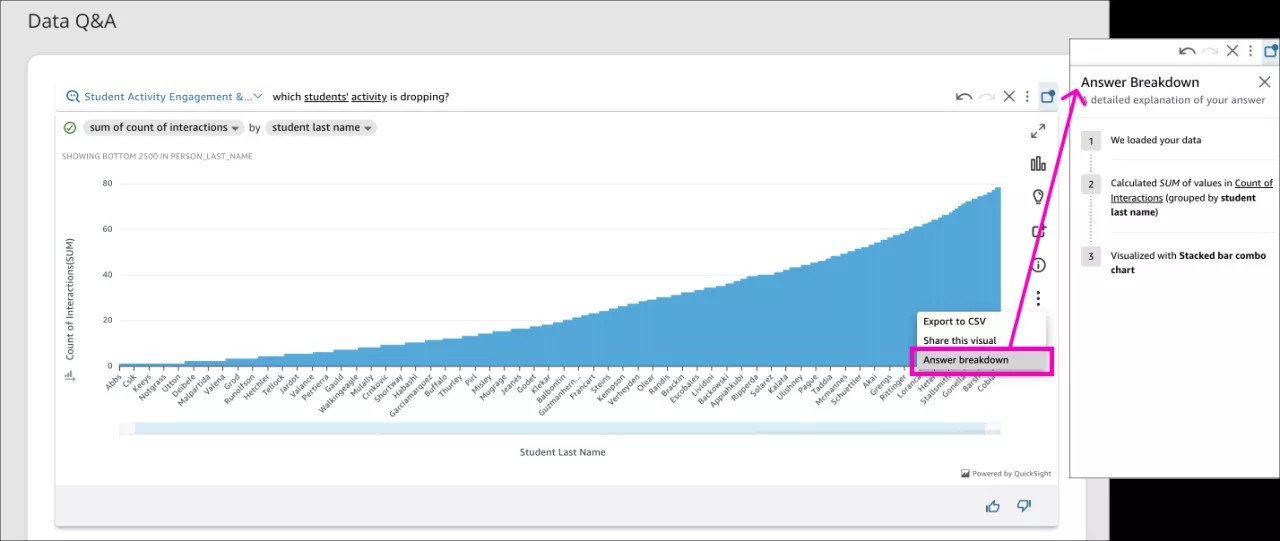
- You can also go to the three dots in the right menu and select Answer Breakdown to see a more detailed description of how the visual answer was built.
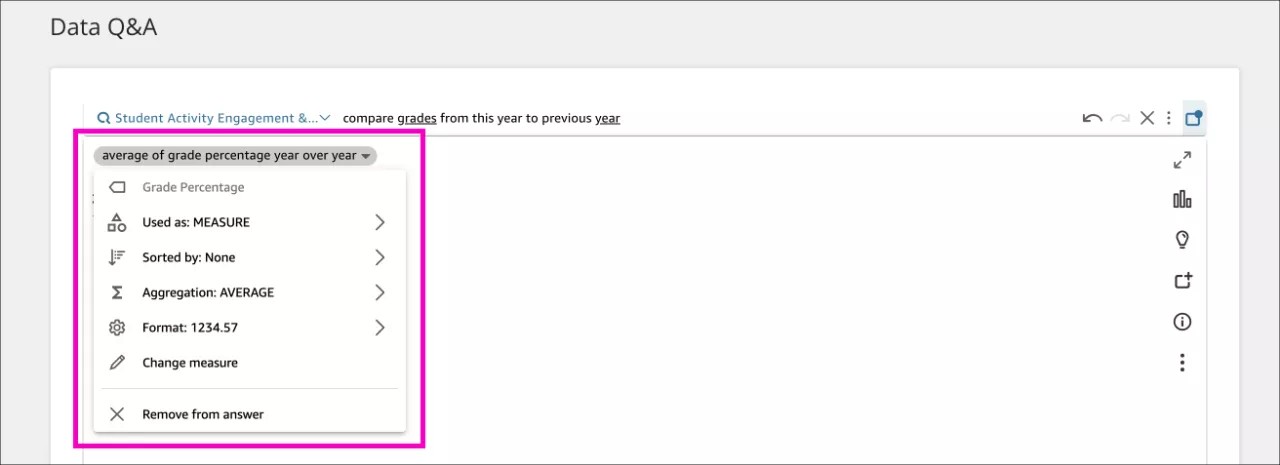
- Switch the measure, format, sorting...
Identify the measure and select the drop down to customize the measure as much as you need.
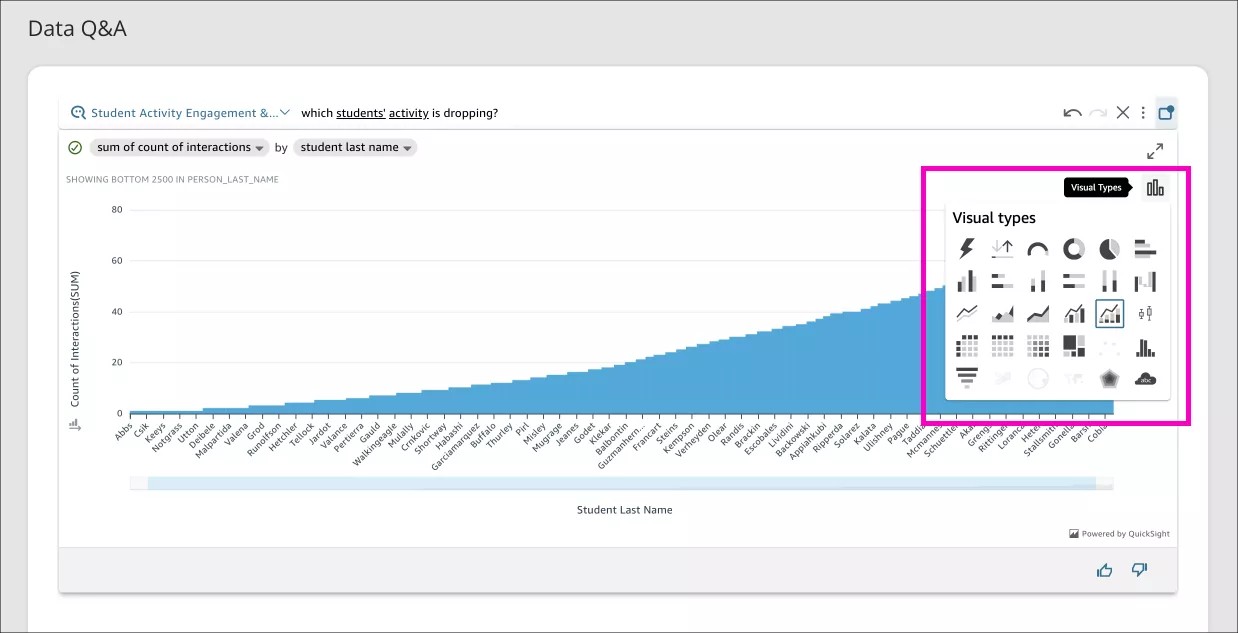
- Change visual types
After you get a custom visual answer, go to the right menu, select the bar chart icon, and change the visual types as many times as you like to find the most appropriate visual answer for your question.
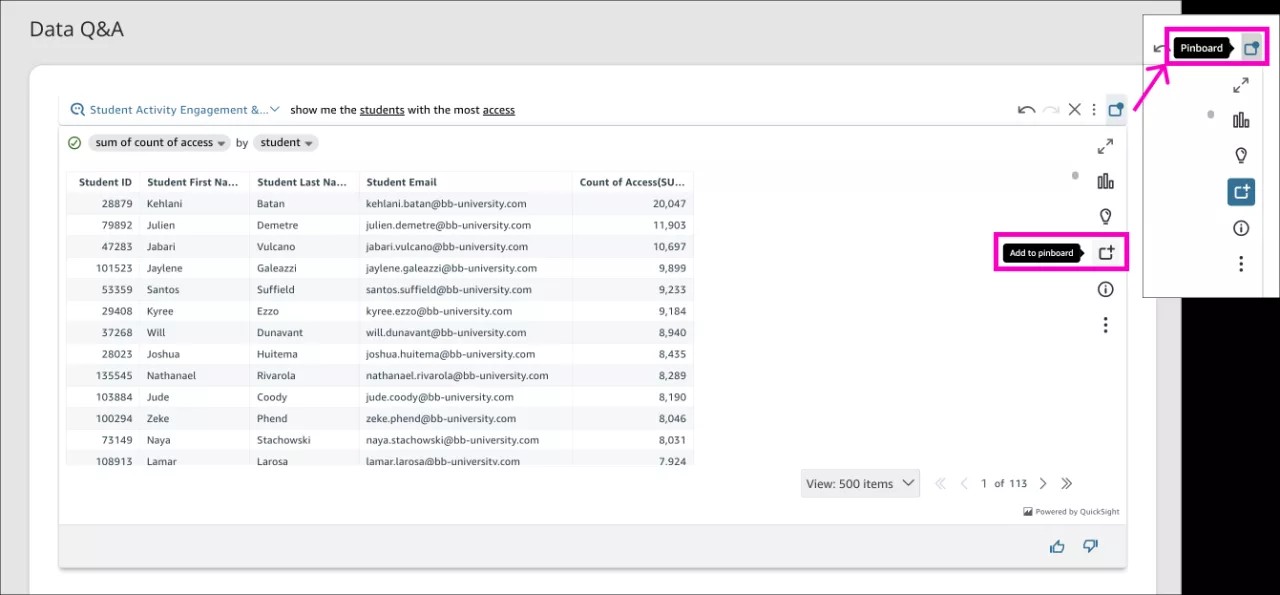
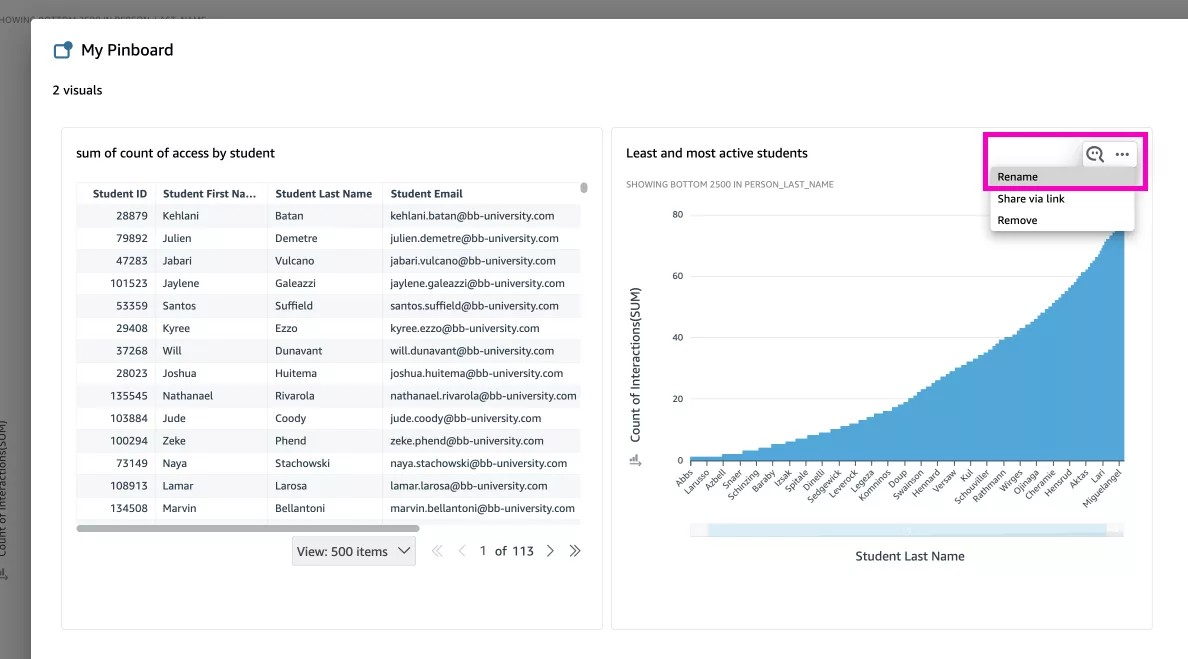
- Add your custom visual answers to a pinboard
You can pin a visual that you find useful and easily check it later in your institution’s pinboard. You can add or remove answers at any time. You can pin your favorite visuals in order to see updated data without having to ask the same question over and over again.
In the right menu, select the pinboard icon to pin the current visual, and find all your pins by selecting the top right icon.
- Change the name of the visual
Go to one of the pinned visualizations, in the top right three dots, select Rename, and type the new title.
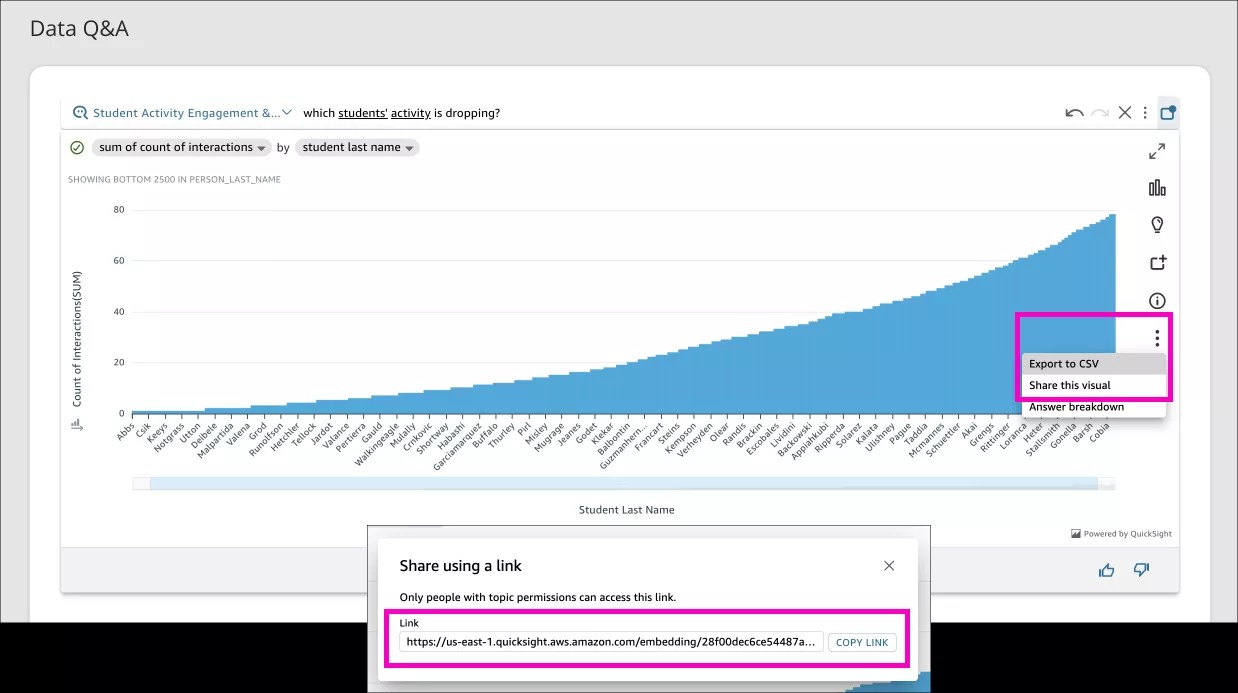
- Export CSV or share a visual with just a link
In the current visual answer or by going to your pinboards, go to the three dots and select the best option Export CSV or Share this visual. Only roles with Author or Viewer permissions can access the shared link. See more about Role-Based Access.
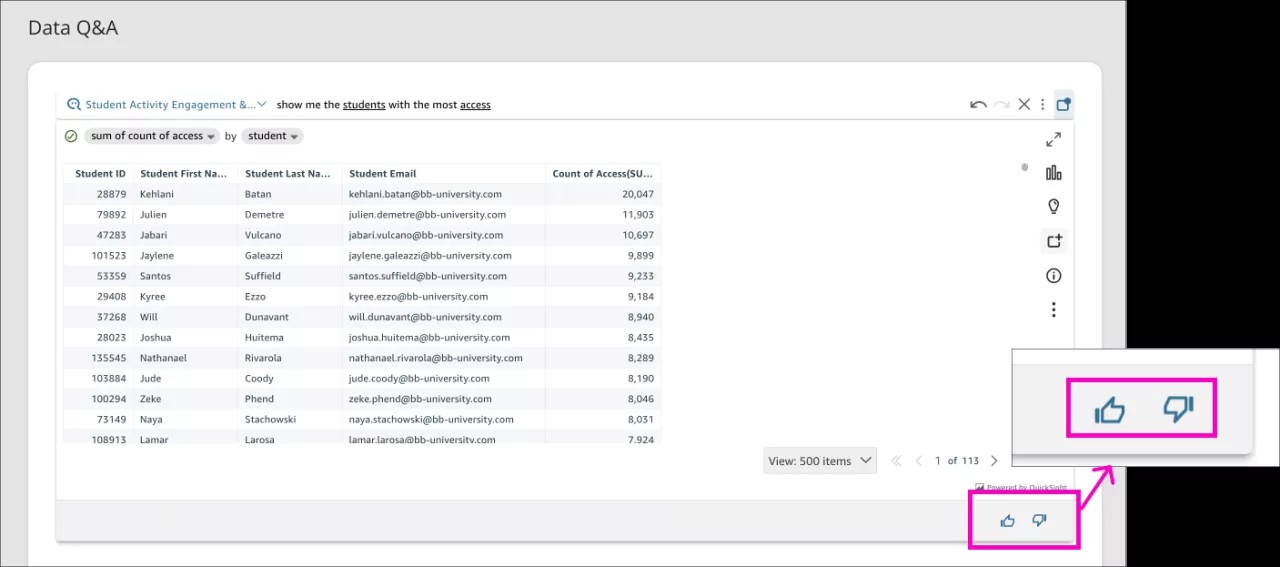
- Give feedback
Whenever you find a visual answer helpful, leave some thumps up or down for Data Q&A to keep improving.