The scenarios in this topic are not all-inclusive nor are they meant as a replacement for your internal operational mandates or philosophies related to the collection of survey data. They are suggestions to maximize the experience for the collection of survey and indirect assessment data.
Institutional Hierarchy as it relates to Assessment and the collection of Enterprise Survey data
Institutional Hierarchy for Community Engagement, available to schools who license the Community Engagement module, is a hierarchy manager user interface designed to allow administrators a way to create a multi-level framework within Blackboard Learn that mirrors their institution's own colleges, schools, departments, non-academic units, and other special populations. While originally designed as a means to delegate administration tasks to other users as appropriate, the Institutional Hierarchy for Community Engagement may also be designed for the purposes of assessment and the collection of survey data.
When designing the hierarchy, it is beneficial to also consider assessment processes: some assessment processes mimic the traditional institution > college/school > department structure, while others move beyond traditional departments and focus on non-academic and student cohorts (for example Library, Greek Life, First-Year Experience Programs, Academic Probation, Disability Services, Junior-level History Majors, PhD Candidates, and so on). Thinking beyond the traditional structure of an institution to design an institutional hierarchy for assessment purposes allows an institution to capture data not traditionally available.
Design a survey for long-term use and longitudinal analysis
Surveys created within Enterprise Surveys are designed for long-term use and for re-deployment across multiple terms. Survey instruments are created independent of response periods. As an institution designs a survey, take special consideration for the long-term use of the survey. Is this survey going to be used for multiple response periods (terms or date ranges)? Are we asking the right questions? Is this the data we would like to capture over a longer time period?
Surveys may be deployed again and again for the collection and comparison of response data, either using the provided Analyze Results tool or by exporting the data. Using this feature allows institutions to perform longitudinal analysis of the same survey instrument over long periods of time by selecting multiple response periods as data is analyzed or downloaded. If the surveys are specific to course evaluations, faculty may also report and track student satisfaction over multiple response periods to gauge student satisfaction and gather feedback for their specific courses.
Deploying surveys across multiple response periods is especially useful for long-term analysis of response data, including course evaluations, student satisfaction, use of services, improvement initiatives, and other indirect assessment processes.
Quantify data by assigning points to responses
When designing the content of a survey, an institution has the option to assign numerical point values to each response. These points contribute to a numerical rating for each answer. When points are applied to responses, the calculated average response to the question will appear in analysis report.
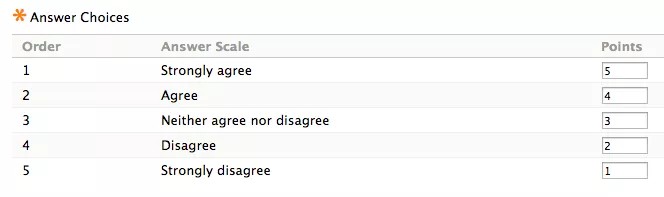
Ratings are then illustrated as an upward-pointing green arrow for mostly positive responses; a side-to-side yellow arrow for neutral responses, and a downward-pointing arrow for mostly negative responses. The analysis report will also calculate an overall response average to the question.
When exporting submission data for a selected survey, the file will contain the numerical value assigned to each response. Using this data will allow a survey owner to then manipulate and create additional reports where weighted responses are represented and compared to one another. For example, by manipulating this data in an external data management tool such as Microsoft Excel, SPSS, SAS, or other similar software program, an institution could compare the change in student satisfaction of a course or instructor over response periods as well as compare the course or instructor specific data to other responses in this or other surveys and show the weighted response for each question as well any change in the response from response period to response period.
Versioning a survey instrument and longitudinal reporting
Once a survey is deployed and data is collected, it is not possible to edit the survey. Not editing a deployed survey is based on best practices and psychometric principles to ensure questions are not changed once a respondent has submitted their survey data. However, it is possible to copy a survey, edit the survey, and create a response period for the updated survey. Results data for each survey can be analyzed using the provided Analyze Results tool or exported and manipulated in an external tool such as SPSS, SAS, Microsoft Excel, or other data management solution. This feature provides institutions a process to track the evolution of a survey instrument over time while still having the ability to compare data across multiple instruments.
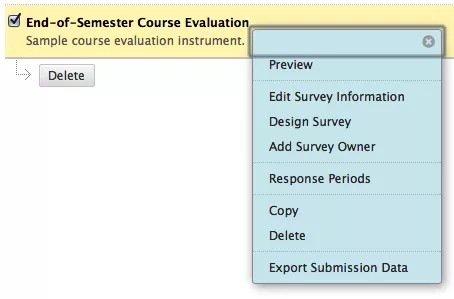
To copy a survey, open the menu next to the survey you want to copy, and select Copy. The survey instrument is duplicated into a new instrument, which may be edited and deployed to a new response period.
Deploy surveys with response sections unique to a specific department
Deploying a survey to a node in the Institutional Hierarchy for Community Engagement allows a survey owner to capture responses specific to that business unit (node) within the institution. Response data is not captured for a business unit unless the survey is deployed to that specific business unit. Enterprise Surveys captures data specific to the business unit against which the survey was deployed. For example:
The School of Business is creating a end-of-semester course evaluation for the school, and the school would like to capture department specific averages for accreditation and reporting purposes. Blackboard Learn users are associated to the School of Business business unit as well as their specific academic disciplines (Marketing, Finance, Accountancy, Travel and Tourism, Economics, Management, Human Resources, and so on). If the survey is deployed to the School of Business business unit, data for the children business units is not captured. It is important to deploy the survey to the most granular level of detail needed to capture that specific business unit data; in this case the departments. If the survey were only needed to capture data for the general School of Business business unit, deploying to the School of Business is acceptable. For this situation, however, the more granular level of survey deployment is preferred to capture academic department-specific data.
Send anonymous surveys and collecting demographic data after the fact
Enterprise Surveys allows a survey owner or manager to collect data anonymously. When collecting results with the anonymous setting enabled,no identifying data is collected when a respondent completes each survey. If demographic data is germane to the institution's indirect assessment processes, do not set the response period to Accept Anonymous Responses when creating the response period.
Identifying information collected in an Enterprise Surveys response period includes username, first name, last name, gender, and email address.
If responses are collected and recipients are known, response data may be exported to a CSV file, and viewed in an external data tool such as Microsoft Excel, SAS, SPSS, or other tool and cross-referenced to the student information system (SIS) for the addition of other demographic data such as GPA, degree program, academic major, and so on.
Deploy surveys to courses with multiple instructors
There are many instances where a set of faculty share teaching responsibilities for a course. Enterprise Surveys collects response data specific to a course section and not a specific user role.
When surveys are deployed to sections where multiple instructors share teaching responsibility, it is possible to collect data for each instructor by creating a survey specific to these sections where multiple pages of the instructor-related questions are present. Students need to be instructed to complete each page of questions for each instructor in the course.
Do not release the results of the survey to the course section. Instead, download the data, parse out data germane to each instructor, and then sent out for review by email or distribution through the Content Management system rather than by automated reporting.
Release results and reports to instructors
When creating a response period for a survey, the survey owner or manager has the opportunity to set the date and time when results are released to instructors through their respective Learn courses if results are to be released to instructors at all.
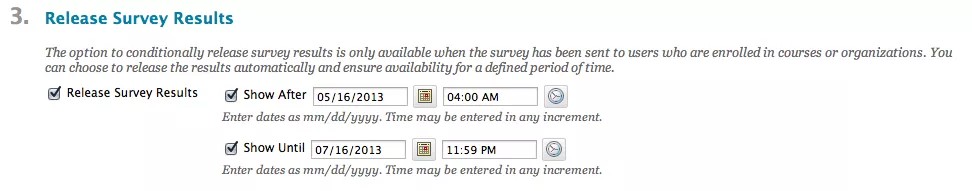
When setting scheduling options to send and close the survey, the survey owner is also able to set when results are released to faculty users. The option to release surveys is off by default. To release results, simply check the box next to Release Survey Results and set a date and time to release the results. The user may set the results to release immediately, so instructors may view results as the data is updated each night, or at a later time after the survey response period is closed (using the Show After setting). Survey owners also have the option to make surveys results only available for a certain time period. By using the Show Until setting, results are only available for review in the Learn course section in the established window. In the image below, the survey closes at 11:59 PM, on May 15, 2013. The results are then made available at 4:00 AM on May 16, 2013, for review by instructors in the surveyed course sections. Results are then no longer available after the set time period.
Releasing results when the survey is in progress allows for faculty to see their results evolve over the course of the response period. This also helps in increasing compliance to see the number of students responding in a given course section. This allows the instructor to remind students to respond and increase student responses. This also allows the instructor to continually monitor results over time.
The Release Survey Results settings may be updated as needed, even after the survey is sent. This is especially useful when a user needs access to results at a future date or if the settings were incorrectly established. Student users do not see survey results. Additionally, the option to conditionally release survey results is only available when the survey has been sent to users who are enrolled in courses or organizations.
Increase response rates for students
One of the primary challenges in collecting data for surveys is the response rate of students and other respondents. Enterprise Surveys provides several tools to aid in increasing response rates: notifications of surveys using notifications in the global navigation menu, announcements in course sections, and email. In addition to these features, surveys created in Enterprise Surveys are also mobile-device friendly. A survey owner or manager may also set automated reminders to alert respondents. Reminders are sent to those who have not completed the survey. Reminders may be sent at a specific interval of hours, days, weeks or months or on a specific date and time.

Each survey reminder is customizable to include variable fields to further inform the student of the purpose of the survey. To learn more about editing reminders, see the How to Create Response Periods topic in this section.
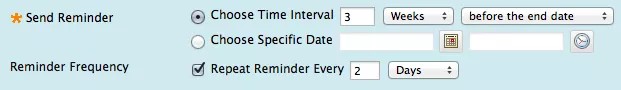
Reminders are only sent to respondents who have not completed the survey.
Make surveys results available to administration and other users
On occasion, users other than the original survey owner or manager require access to survey data for the purposes of reporting against a selection of courses, or a specific business until within an institution. Rather than creating specific surveys for each business unit, a survey owner or manager may add additional users as survey owners. Adding these users as owners grants the specified users access to survey data. Each owner may export data or analyze results for their specific business units for the survey as a whole.
This process is especially useful when multiple users must access data for program review, planning, faculty review, gauging student satisfaction, accreditation, or other non-academic processes such as reporting against surveys collected for a first-year program, library services, or co-curricular programming.
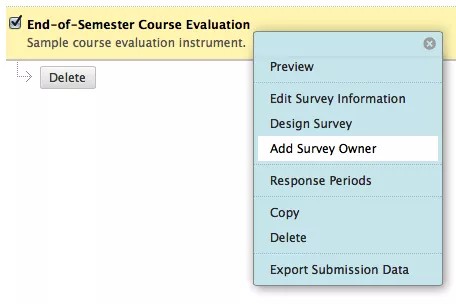
Add a survey owner
- Log in to Blackboard as the survey manager or owner of the survey for which additional owners will be added.
- Select Enterprise Surveys from the Tools menu on the portal page or the System Admin page.
Clients licensing Outcomes Assessment may also access Enterprise Surveys using the Outcomes Assessment Dashboard.
- Open the menu for the survey where the owner(s) need to be added, then select Add Survey Owner.
- Select Add Owner to browse for, and select, the appropriate survey owners
- Select Submit.
Suggestions for using exported submission data
Response data collected by Enterprise Surveys may be exported and manipulated in an external data management tool such as Microsoft Excel, SPSS, SAS, or other similar software program. Exported data may be manipulated and used for a variety of reporting requirements across the institution, including:
- Creating custom reports specific to a program and/or academic unit.
- Cross-referencing data to the student information system to compare results by other demographic information such as academic major, GPA, degree program, financial aid status, or other such identifying information.
- Making data and reports available to external stakeholders for the purposes of institutional accreditation, programmatic accreditation, program review, strategic planning, and other similar processes.
- Data with point values associated to responses created quantifiable response data through weighted responses rather than qualitative data through a simple count of responses.
- Making data available to students using a sanitized and searchable database as a means to gauge the satisfaction of previous students regarding faculty for the purposes of schedule development and perceived quality.
Blackboard would appreciate users of Enterprise Surveys to share how exported data is used within their institution for the above mentioned processes or more.