Analytics for Learn is an optional service that allows you to run different reports for your courses that keep track of how your students are performing. Analytics for Learn extracts data from Blackboard Learn, transforms it, and brings it into an analytics framework where it's combined with data from your institution's SIS system.
To access these reports, your institution must have licensed, installed, and activated Analytics for Learn.
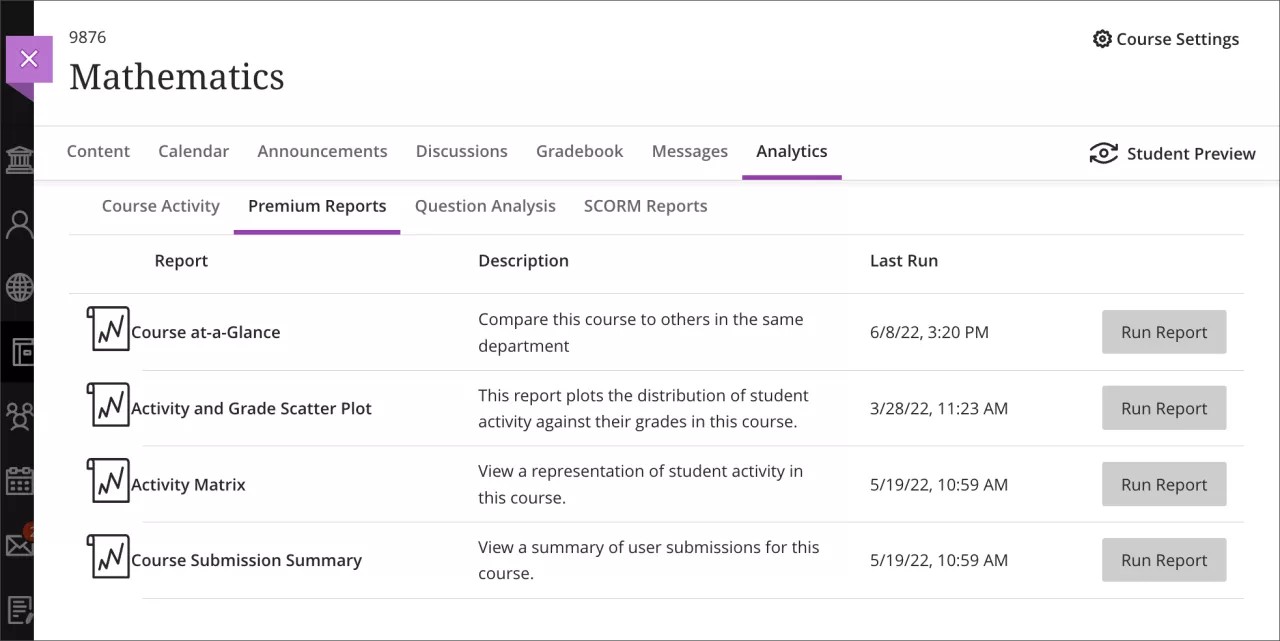
Analytics for Learn reports
Analytics for Learn provides these reports:
- Course at-a-Glance: Interactions, submissions, and time in course compared to similar courses in your department.
- Activity and Grade Scatter Plot: A scatter plot of your course activity and your grades in the course.
- Activity Matrix: This report compares each student's number of submissions to the average across all students in that course. The report includes a graph of submission trends over the entire term, number of submissions, the average number of submissions in the course, days since the student's last submission, and last submission type.
- Course Submission Summary: Submission information for each student including assignments, tests, surveys, and graded discussions, blogs, journals, and wikis.
Access Analytics for Learn reports
Select the Analytics on the navigation bar. On the Course Analytics page, select Reports. The Reports page displays a list of reports you can run, along with the report description, and the time of last run. Select Run Report to generate the analytics report. Analytics for Learn reports open in a separate tab.
If you have Predict and Analytics for Learn, you'll see options for Reports and Student Risk Reports on the Course Analytics page. Select Reports to see the Analytics for Learn options.
You can export the list of students from the reporting system and import the list into an application such as Microsoft® Excel® for further analysis.
Question Analysis tab
Question analysis provides statistics on overall performance, assessment quality, and individual questions. This data helps you recognize questions that might be poor discriminators of student performance. Question analysis is for assessments with questions. You can run a report before all submissions are in if you want to check the quality of your questions and make changes.