
Find out more about Anthology Illuminate
-
To keep you up-to-date with the latest releases for Anthology Illuminate:
-
Keep track of what we've released in the past in Archived Release Notes.
Release Notes
Illuminate December 2023 Release
Continuous Delivery | Release to Production 13 December 2023
New Features
Our December 2023 release includes:
Institutional administrators now have an overview of the users who have access to the institution’s reports and the number of licenses used per month for better control.
Only available for institutions with Institutional Authentication.
More about License and User management
Illuminate Enhanced Reporting November 2023 Release
Continuous Delivery | Release to Production 15 November 2023
New Features
Our November 2023 release includes:
- Custom Reports is now available for all clients with Enhanced Reporting. This new enhanced feature will allow you to create custom reports that meet your needs and deploy them alongside our standard (pre-built) reports.
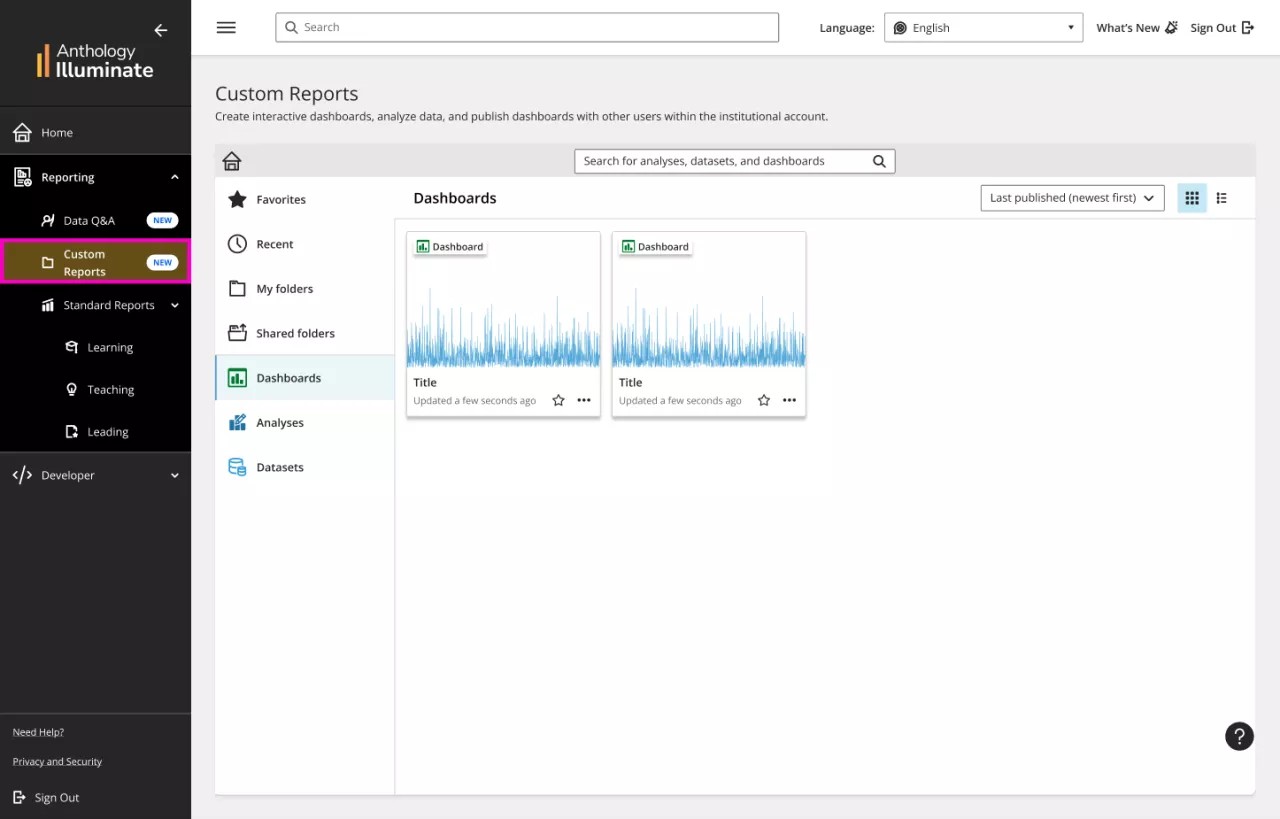
Find out how Custom Reports works.
- Data Q&A is now available to all clients with Enhanced Reporting. This new feature will allow you to explore your institutional data regardless of your technical expertise by asking questions in natural language and getting customizable visual answers, saving time and effort.
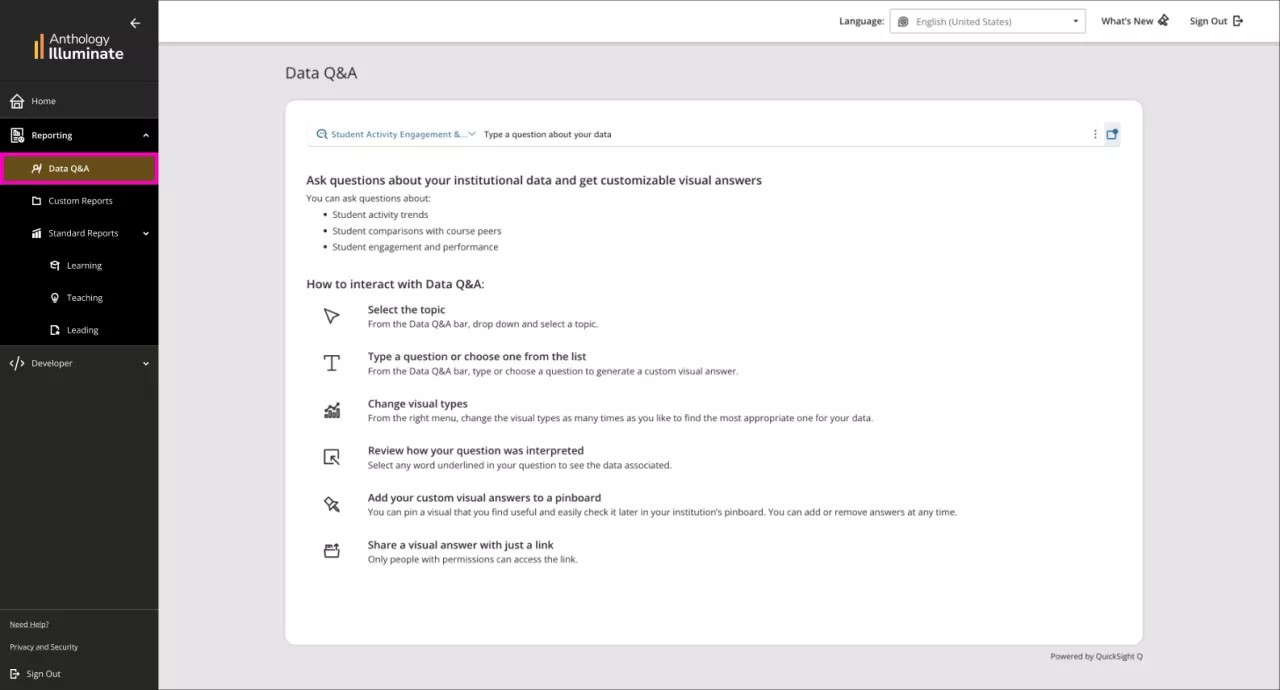
Find out how Data Q&A works.
Blackboard Data Reporting October 2023 Release
Continuous Delivery | Release to Production 24 October 2023
Updated Features
Blackboard Data is now Anthology Illuminate:
Register for our webinar to know more:
Find out more in our Community blog post.
____________________
Our October 2023 release includes one new report in the Learning area and the following improvements:
The Student Summary Report provides insight into an individual student’s activity, engagement, and performance across all their current and historical courses. It allows you to view what a student has done in courses in a given timeframe. The report has 3 tabs:
- Overview: Provides high-level information on students’ activity over time.
- Engagement and Performance: Delivers detailed insights on a student’s engagement and performance across courses.
- Activity Log: Summarizes a student’s granular activity on courses within a specific timeframe.
Find out more about Student Summary Report.
Other improvements & bug fixes:
- In Learning, in the Student Engagement Report we fixed an issue with filtering unavailable enrollments, eliminating duplicate counts.
- In Learning, the Student Performance and Grades and the Social and Collaborative Engagement Reports are now supported for Role Based Access for clients with Institutional Authentication using Blackboard Learn as the identity provider.
- Additionally, Illuminate Reporting is now localized to Traditional Chinese.
Blackboard Data Access Control
Continuous Delivery | Release to Production 24 October 2023
In our October 2023 release:
- In settings, Institutional administrators now have a Credits Usage card with the number of credits used and the remaining for the month in their Snowflake Reader account, for better management.
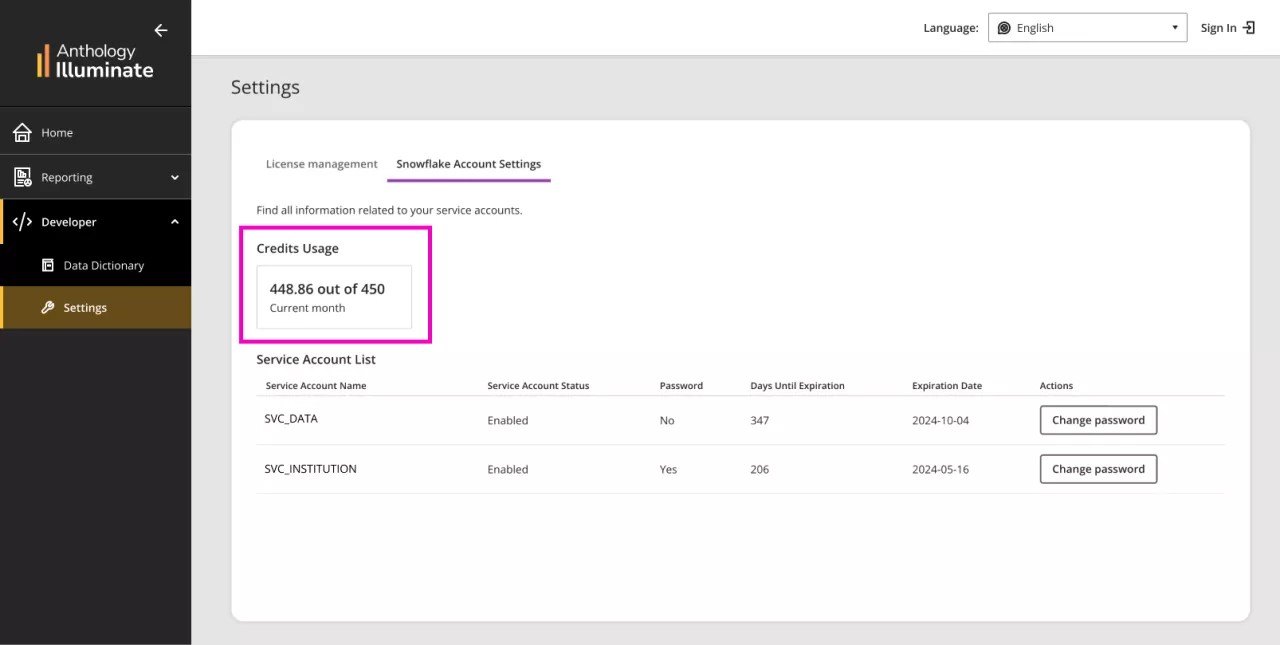
More about Credits Usage and Settings
- We are implementing a new process to optimize Illuminate Reporting, called Sleep Mode, which will help us ensure the efficient use of resources while making sure you have continued access to reporting. Reporting Instances that have not been used for a period of 30 days will be temporarily placed in a dormant state, you will be prompted to awaken the system when you next login.
Sleep mode will not be activated for clients of Enhanced Reporting.
Blackboard Data Reporting September 2023 Release
Continuous Delivery | Release to Production 06 September 2023
The September 2023 release of Blackboard Data Reporting, includes the following improvements:
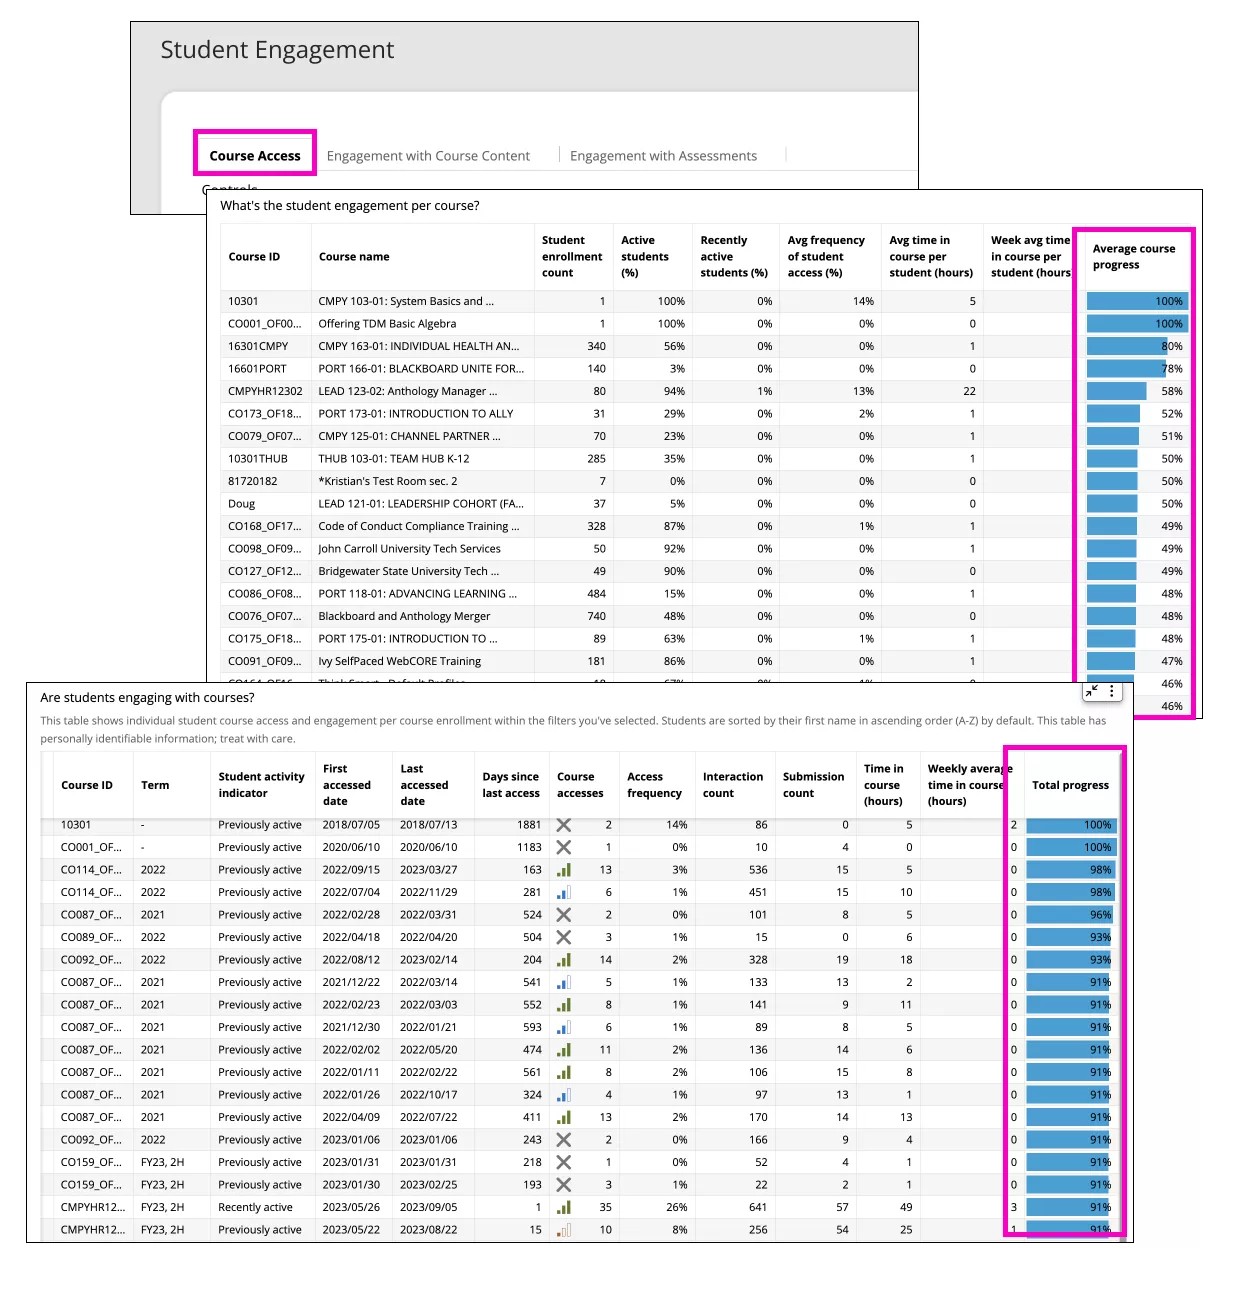
In Learning, the Course Access tab in the Student Engagement Report has been updated with the following enhancements:
- New column Average Course Progress is included to the table What’s student engagement per course? showing the percentage of items completed average across all enrollments.
- New column Total Progress is included to the table Are students engaging with courses? showing the percentage of items "completed" by student.
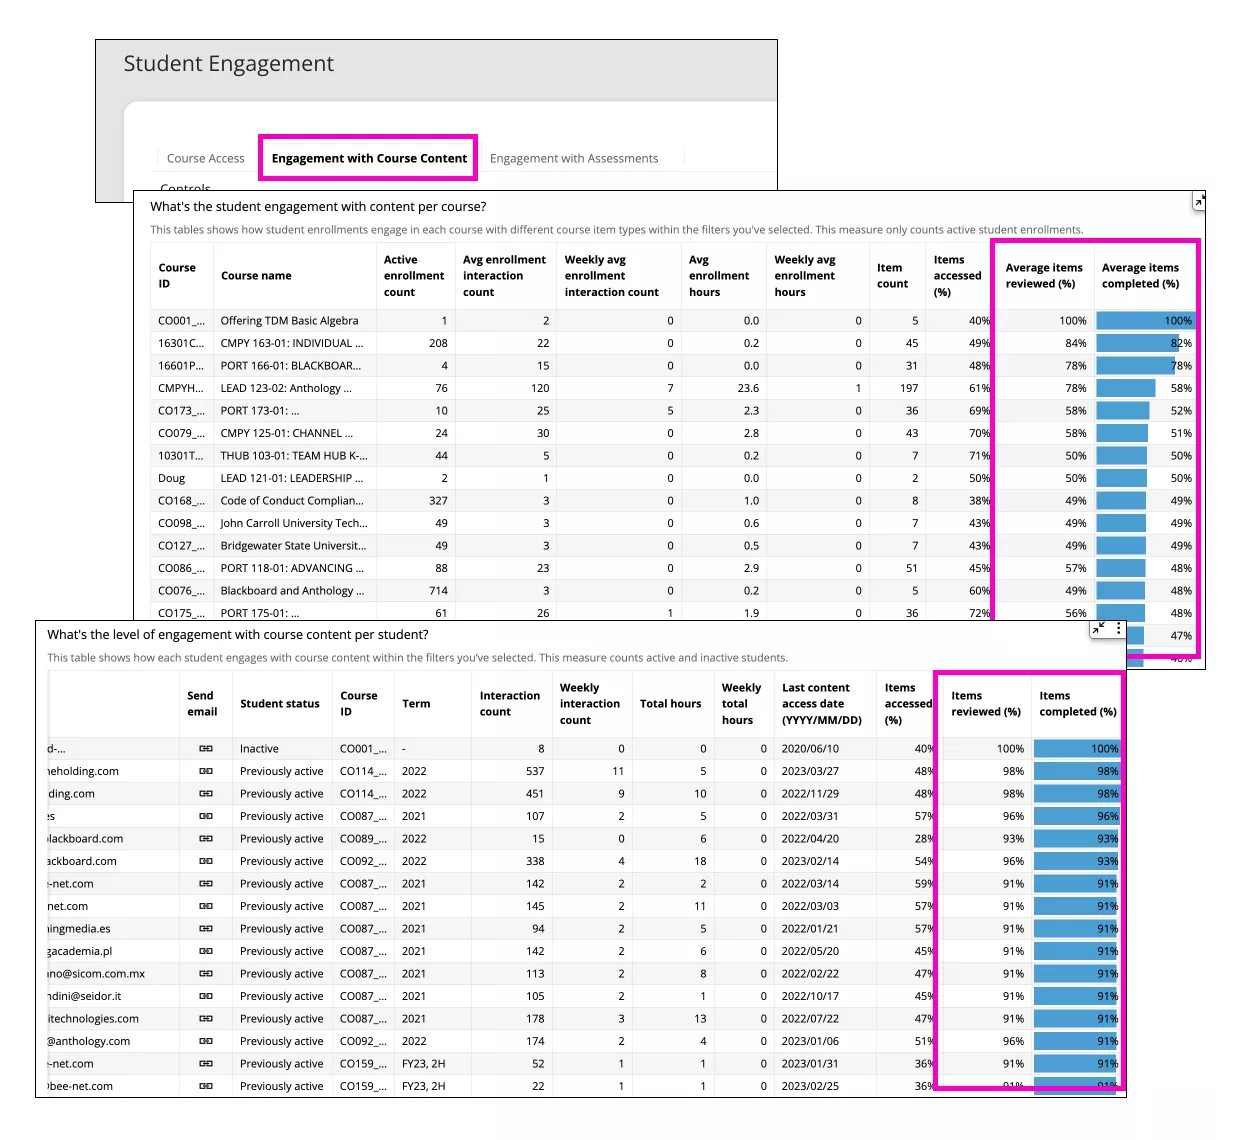
In Learning, the Engagement with Course Content tab in the Student Engagement Report has been updated with the following enhancements:
- Two new columns Average items reviewed and Average items completed are included to the table What’s student engagement per course? showing the percentage of items reviewed and completed average across all enrollments.
- Two new columns Items reviewed and Items completed are included to the table Are students engaging with courses? showing the percentage of items reviewed and completed by student.
Blackboard Data Reporting August 2023 Release
Continuous Delivery | Release to Production 09 August 2023
The August 2023 release of Blackboard Data Reporting includes one new report in the Teaching area :
The Course Summary report is a holistic report about a single course that provides insight into student and instructor behavior in a course. The report has four tabs:
- Course Overview: providing high level statistics about the course and metadata.
- Student Engagement and Performance: giving detailed information on student engagement and performance.
- Instructional Practice: providing a detailed view of the instructional practices based on the course design, Instructor-Student engagement, and student success.
- Course Design: providing an understanding of how this course has been designed based on the item types used and their usage over time.
This report will allow you to filter students' activity within a given time scale.
Find out more about Course Summary report.
Blackboard Data July 2023 Release
Continuous Delivery | Release to Production 25 July 2023
Role-Based Access, our new feature:
Blackboard Data Reporting June 2023 Release
Continuous Delivery | Release to Production 6 June 2023
In our June release of Blackboard Data, we have deployed a new sub-model for SIS data, CDM_SIS. Initially, this is empty for all clients but available in your Snowflake reader account so that you can browse the structure. It is also documented in the data dictionary. In the future, we plan to automatically populate this sub-model for all clients licensing both Learn SaaS and Anthology Student SIS, additionally, we are considering an ingestion service to enable all clients to populate this sub-model with SIS data.
More information on these future plans will be shared in our product roadmap sessions.
Additionally, we have added a new table containing course progress data for students in Ultra courses with this feature enabled. In future, we plan to add this valuable data to relevant reports in Blackboard Data Reporting.
For more information, see the CDM Change Log and Data Dictionary entries listed therein.
Blackboard Data Institutional Authentication Availability
New Features | Release to Production 08 March 2023
In our March release of Blackboard Data, we have deployed Institutional Authentication for clients hosted in Canada, Singapore and Sydney. This feature offers Single-Sign-On using SAML or Blackboard Learn as identity provider and enables greater control over user access and can be set up through a support ticket.
Find out more in Institutional Authentication
Blackboard Data Access Control
Continuous Delivery | Release to Production 21 September 2022
In our September release of Blackboard Data, we are enabling institutional administrators to control who has access to Blackboard Data Developer (Snowflake) and the Settings page (where the service account credentials are managed), or access only to Blackboard Data Reporting.
You can review the full instructions on how to restrict access to Developer and Settings, but, in brief, you need to:
- Adopt Blackboard Login. If you have not already done so, submit a support ticket requesting help.
- Assign a different system role to users who need access only to Blackboard Data Reporting. We recommend a new role with no other permissions.
- Submit a support ticket asking for this role to be mapped to the Blackboard Data Report Viewer role.
We believe this new feature removes a significant barrier to the adoption of Blackboard Data Reporting for some institutions.
Each institution is currently allowed up to 20 seat licenses for Blackboard Data, so we encourage institutions to use these accounts for key institutional decision makers like educational, online learning, and EdTech management.
Blackboard Data Reporting Sydney & Canada Release
Continuous Delivery | Release to Production 15 June 2022
Blackboard Data, Reporting, New Features
We are pleased to announce another key milestone for Blackboard Data: the release of the Blackboard Data Reporting solution to SaaS clients hosted in the Canada and Sydney AWS hosting regions.
This will provide the same reports on Learning, Teaching, and Leading that were previously available only to clients hosted in the US, EU, and Singapore locations. As in other regions, Sydney-hosted clients may now request up to 20 individual accounts to support institutional leaders.
Blackboard Data Reporting May 2022 Release
Continuous Delivery | Release to Production 10 May 2022
Reporting, Updated Features, New Features
The May 2022 release of Blackboard Data Reporting includes improvements to two reports in the Learning reporting area.
Enrollment-level detail added to:
- The “Grade Boundary” report (Learning > Student Performance and Grades).
- The “Course Access” report: (Learning > Student Engagement).
Each of these reports now includes a table containing one row per student course enrollment, and appropriate metrics for the context of the report. This will therefore list all students on all courses within the filters you’ve selected.
The student listing includes features developed directly from feedback gathered in our Blackboard Data Insiders user group:
- First and Last Name separation for easier sorting.
- A “mailto” link that will address an email to the chosen student in your default email application with one click.
- A comparative indicator on the “Course Access” column that indicates whether the student’s course accesses are below, within, or above the typical range for the course:
- 1 bar – Low – in the lowest quartile.

- 2 bars – Normal – within the interquartile range (middle two quartiles).

- 3 bars – High – in the top quartile.

- 1 bar – Low – in the lowest quartile.
Enhanced course listing:
The course listing has been enhanced and now includes all appropriate courses within your filter selection, where previously it included only the top/bottom 10 courses.
Visual filtering:
To make it easier to find actionable information, these reports also use visual filtering, where your selection within a visualization will further filter the student table.
Examples:
- In Course Access, you can select the “Inactive” segment of the donut chart, and the student table will only list inactive enrollments.
- You can also select a course in the course listing and its enrollments will be displayed in the student table.
Visual filtering walkthrough video
Visual filtering is additive, so if you select both prior examples, the student table will list inactive enrollments in your chosen course only. You can reset visual filtering by selecting the funnel icon in the contextual menu of the visualization and either selecting the “X” to remove an individual filter or “Clear” to remove all visual filtering. Visual filtering is also used in the existing Course Administration report (Leading reporting area).
As with all visualizations, you can maximize them to take up all available space, and export to CSV, using the contextual menu that appears in the top-right corner when you hover over the visualization.
Continuous feedback
We'd like to hear your feedback on these reports or any other reports.
You can submit, comment upon, and vote for new features in the Feature Requests tab of “What’s New”.
Blackboard Data Reporting Singapore Release
Continuous Delivery | Release to Production 05 April 2022
Blackboard Data, Reporting, New Features
We are pleased to announce another key milestone for Blackboard Data: the release of the Blackboard Data Reporting solution to SaaS clients hosted in the Singapore AWS hosting region.
This will provide the same reports on Learning, Teaching, and Leading that were previously available only to clients hosted in the EU and US locations. As in other regions, Singapore-hosted clients may now request up to 20 individual accounts to support institutional leaders.
Blackboard Data March 2022 Release
Continuous Delivery | Release to Production 15 March 2022
Blackboard Data, Reporting, Developer, Updated Features, New Features
- The Blackboard Data user interface found at data.blackboard.com has been updated to provide a better experience for first-time users, including introductory information about Blackboard Data and an explanation of the new reports now available.
- A new Blackboard Data Developer area contains the existing Settings page for management of the Service account, as well as a convenient link to your Snowflake instance.
New Blackboard Data Reporting March 2022 Release
Continuous Delivery | Release to Production 15 March 2022
Reporting, Updated Features, New Features
We’re pleased to announce the release of Blackboard Data Reporting, a new suite of reports to help institutional leaders to make data-informed decisions about policy and practice within the EdTech platform.
This solution includes three reporting areas:
-
Learning: relating to learner activity, engagement, and performance.
-
Teaching: relating to instructional practice and course design.
-
Leading: relating to institutional success and tool adoption. Includes improved versions of the adoption reports previously in Blackboard Reporting.
These reports comprise 21 dashboards and more than 100 visualizations and insights, and our question-focused user experience makes it easy to understand the purpose of each insight.
Blackboard Data Reporting is included as a standard for Learn SaaS clients in eligible locations.
As this is an early release of this solution, there are some known issues relating to the accessibility of the reporting content, for which we’re working closely with AWS QuickSight,the business intelligence tool we use to develop these reports, to resolve as a matter of urgency. The reports are currently only available in US English, but we’re working on localization and expect to have the reports localized in 14 languages within Q2.
We'd like your help in improving these reports and generating new ideas, and to support this we'll prompt users with targeted questions in the What’s New panel in the reports, where you will also find a new Feature Requests panel to enable submission and voting on new ideas.
In order to support broader usage of these reports across your institution, we’re increasing the number of individual accounts you can request from 5 to 20, and we would encourage you to use these for institutional leaders such as:
-
Provosts
-
Deans
-
Heads of eLearning/Curriculum Development
-
Heads of Distance and Online Learning
-
Student Success leadership
Learn more about the Blackboard Data Reporting
Follow the release notes page
Get an email notification when we update the release notes page.
- Go to Follow this page! at the bottom of the page.
- Register your email address.
- Select Follow.
- Solve CAPTCHA.
- Confirm your email address in the email sent to you within the next 24 hours.
What’s New
- Select What's New in the top right corner to open the latest updates panel.
The What’s new panel is currently only available in English. This panel will be available in more languages throughout 2022 and 2023.