Analytics for Learn is an optional service that allows you to run different reports for your courses that keep track of how your students are performing. Analytics for Learn extracts data from Blackboard Learn, transforms it, and brings it into an analytics framework where it's combined with data from your institution's SIS system.
To access these reports, your institution must have installed and activated Analytics for Learn.
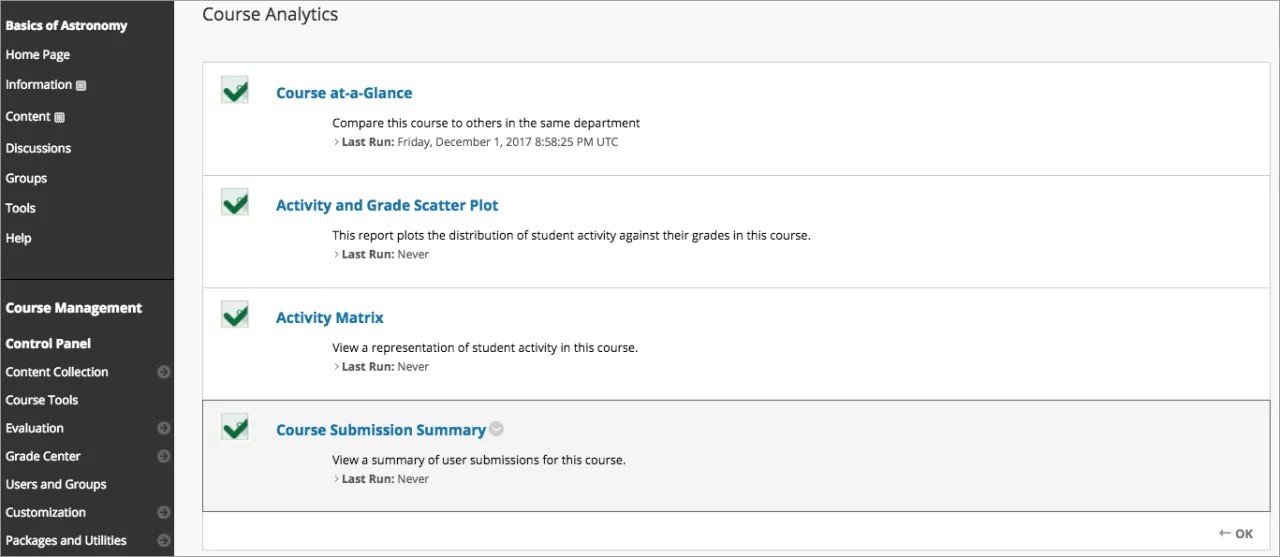
Analytics for Learn reports
Analytics for Learn provides these reports:
- Course at-a-Glance: Interactions, submissions, and time in course compared to similar courses in your department.
- Activity and Grade Scatter Plot: A scatter plot of your course activity and your grades in the course.
- Activity Matrix: This report compares each student's number of submissions to the average across all students in that course. The report includes a graph of submission trends over the entire term, number of submissions, the average number of submissions in the course, days since the student's last submission, and last submission type.
- Course Submission Summary Report: Submission information for each student including assignments, tests, surveys, and graded discussions, blogs, journals, and wikis.
- Activity Compared to Others (student only): Students can select this option to view their activity compared to others in their course. Information includes the number of submissions and time spent in course in Learn.
Access Analytics for Learn reports
Control Panel > Evaluation > Course Analytics
From the Course Analytics page, select the report you want to run. The report opens in a new tab. You can export the list of students from the reporting system and import the list into an application such as Microsoft® Excel® for further analysis.