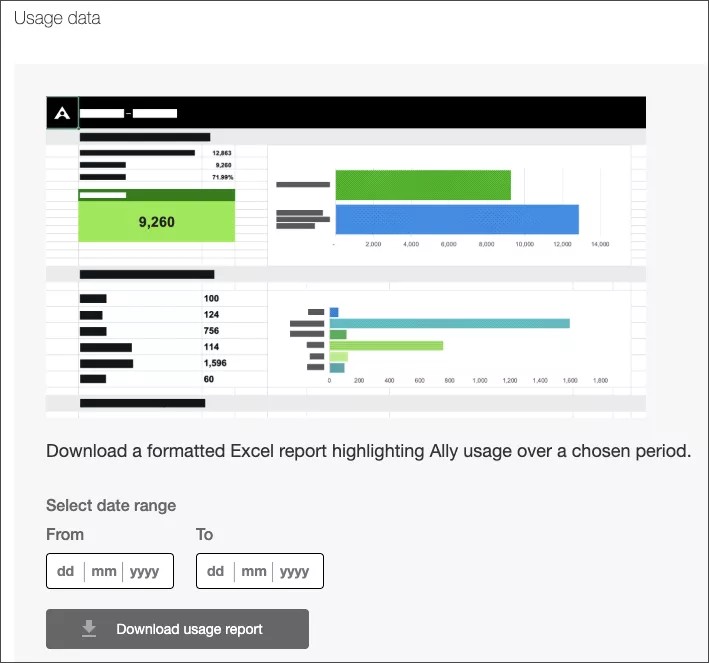
Create an Ally Usage Report
The Usage reports shows details about how your students and instructors are using Ally. Find out how often students download an alternative format and instructors fix accessibility issues.
The report is a spreadsheet that is split into five worksheets.
- Alternative Format Launches
- Alternative Format Weekly
- Instructor Feedback Launches
- Instructor Feedback Weekly
- Data
Each worksheet has details related to a date range you pick.
Alternative Format Launches
The Alternative Format Launches worksheet shows alternative format engagement and distribution over a certain date range.
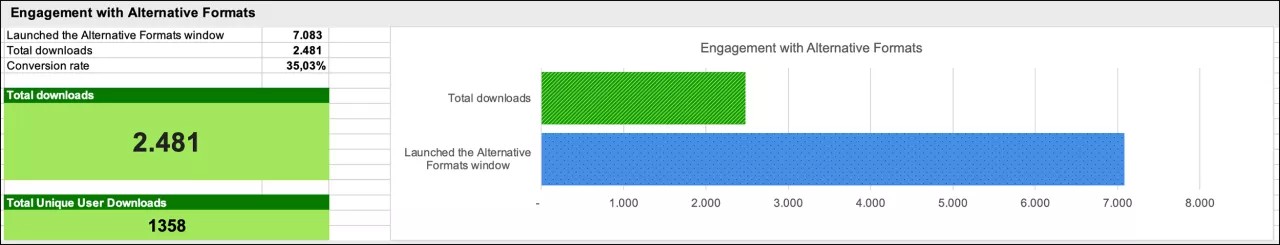
Engagement with Alternative Formats
The worksheet starts with details on how many times the Alternative Formats panel was opened and how often an alternative format was downloaded.
A conversion rate shows the percentage of downloads out of the total number of times the panel was opened.
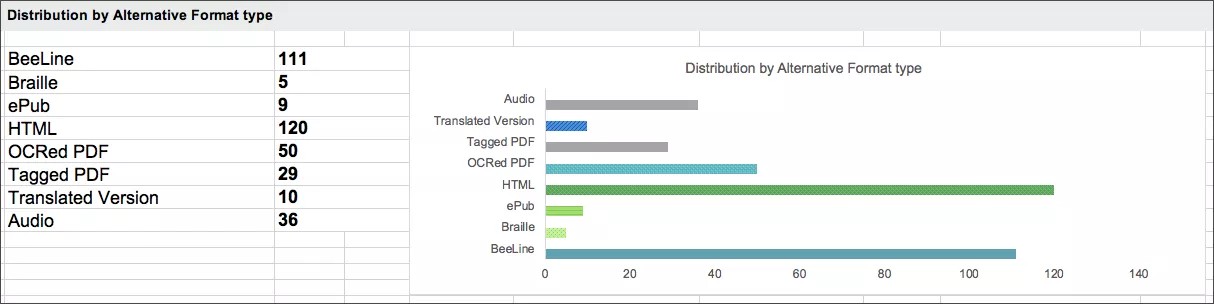
Distribution by Alternative Formats
See which alternative formats are popular, or most downloaded, by your students. Each alternative format is listed with the number of times it was downloaded.
Sections with Alternative Format downloads
See the sections students downloaded alternative formats from.

Ally Usage Alternative Format Week and Instructor Feedback
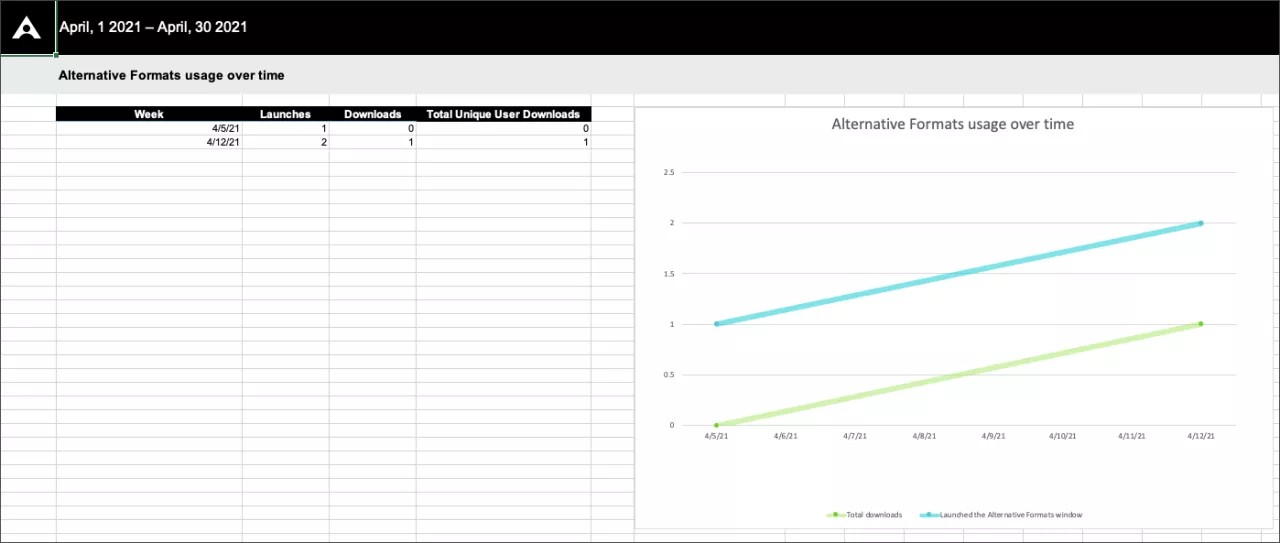
Alternative Format Weekly
The Alternative Format Weekly worksheet shows weekly activity over the report's date range. You can see how many times students opened the panel each week. You can also see how many times they downloaded an alternative format each week.
Weeks start on Mondays. You can't report on the current day.
Instructor Feedback Launches
The Instructor Feedback Launches worksheet shows instructor feedback engagement and distribution over a certain date range.
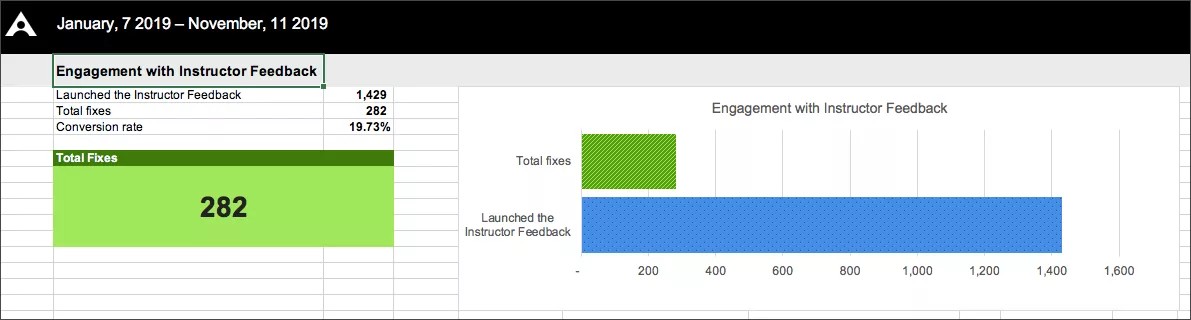
Engagement with Instructor Feedback
The worksheet starts with details on how many times the Instructor Feedback panel was opened and how often instructors fixed an accessibility issue as a result.
A conversion rate shows the percentage of fixes out of the total number of times the panel was opened.
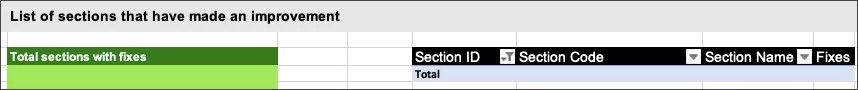
Sections that made improvements
See the sections instructors fixed accessibility issues in.
Ally Usage Instructor Feedback Weekly
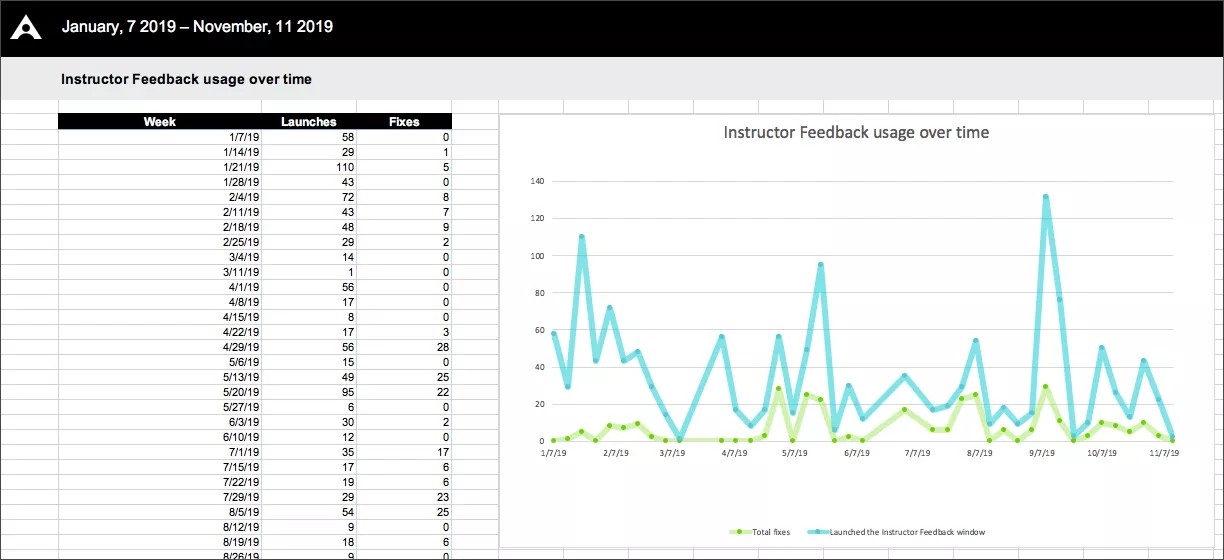
Instructor Feedback Weekly
The Instructor Feedback Weekly worksheet shows weekly activity over the report's date range. You can see how many times instructors opened the panel each week. You can also see how many times they fixed accessibility issues each week.
Weeks start on Mondays. You can't report on the current day.
Data
The Data worksheet shows specific details for each time a panel was opened, a format was downloaded, and an accessibility issue was fixed.
- ID: The unique ID for the row/event.
- Section ID: The section ID.
- Section Code: The section code.
- Section Name: The section name.
- Term ID: The term ID.
- Term Name: The term name.
- Content ID: The content ID.
- Event: Describes the action. For example, if someone opened the Alternative formats or Instructor Feedback panel.
- AFLaunch: Shows if someone opened the Alternative format panel or not. 1 means the panel opened. 0 means the panel stayed closed.
- Download: Shows if someone downloaded an alternative format. 1 means one or more formats downloaded. 0 means no format downloaded.
- IFLaunch: Shows if someone opened the Instructor Feedback panel or not. 1 means the panel opened. 0 means the panel stayed closed.
- Fix: Shows if someone fixed an accessibility issue from the Instructor Feedback panel. 1 means one or more issues were fixed. 0 means nothing was fixed.
- Timestamp: Shows when the event occurred. The timestamp is in the number of seconds since January 1, 1970.
- Client: The client ID.
- File Type: Identifies the file type in the event. For example, image or presentation.
- Format Type: Identifies the alternative format downloaded. Format Type is blank when Download is 0.
Tts represents the audio format.
- Score Before: The accessibility score for the section before improvements to the content. Score Before is blank when Fix is 0.
- Score After: The accessibility score for the section after improvements to the content. Score After is blank when Fix is 0.
- Improved: Shows if the accessibility score improved after the file was fixed. 1 means the score improved. 0 means the score didn't improve. Improved is blank when Fix is 0.
- Week: Shows the first day of the week the event occurred. The week is in the number of days, to the start of the week, since December 30, 1899.
- AF: Shows activity with the Alternative Format panel. 1 means there was activity. The panel may have opened or a format downloaded. 0 means there was no activity.
- IF: Shows activity with the Instructor Feedback panel. 1 means there was activity. The panel may have opened or an issues fixed. 0 means there was no activity.