Get insight into your students' activity
As an instructor, you can see when your students opened, started, and submitted tests and assignments with the Student Activity Report for Assessments. In general, this feature looks and functions the same whether you're working in an Original or Ultra course. In an Original course, you can also view student activity for Kaltura multimedia content.
You can also view activity for discussions. Discussion analytics provide you with insights to forum participants and activity. This information can help you identify students who are participating or may need help and encouragement. You can access discussion analytics from the Discussions or Course Content pages.
Topics on this page include:
Access student activity for an assessment
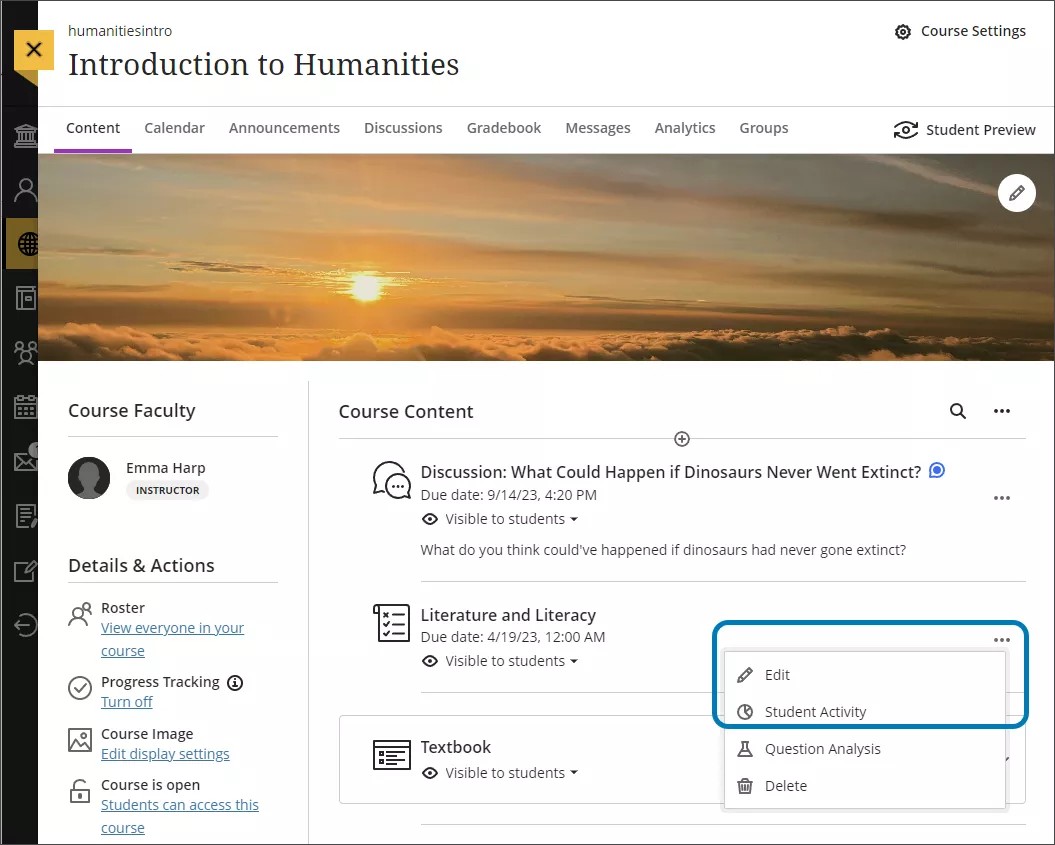
In Ultra, you can access student activity data from the Course Content page. Select an assessment's dropdown menu and select Student Activity.
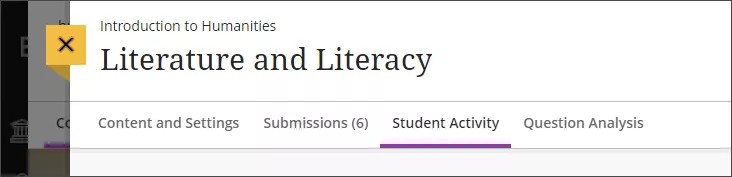
You can also access student activity data on an assessment’s page by selecting the Student Activity tab.
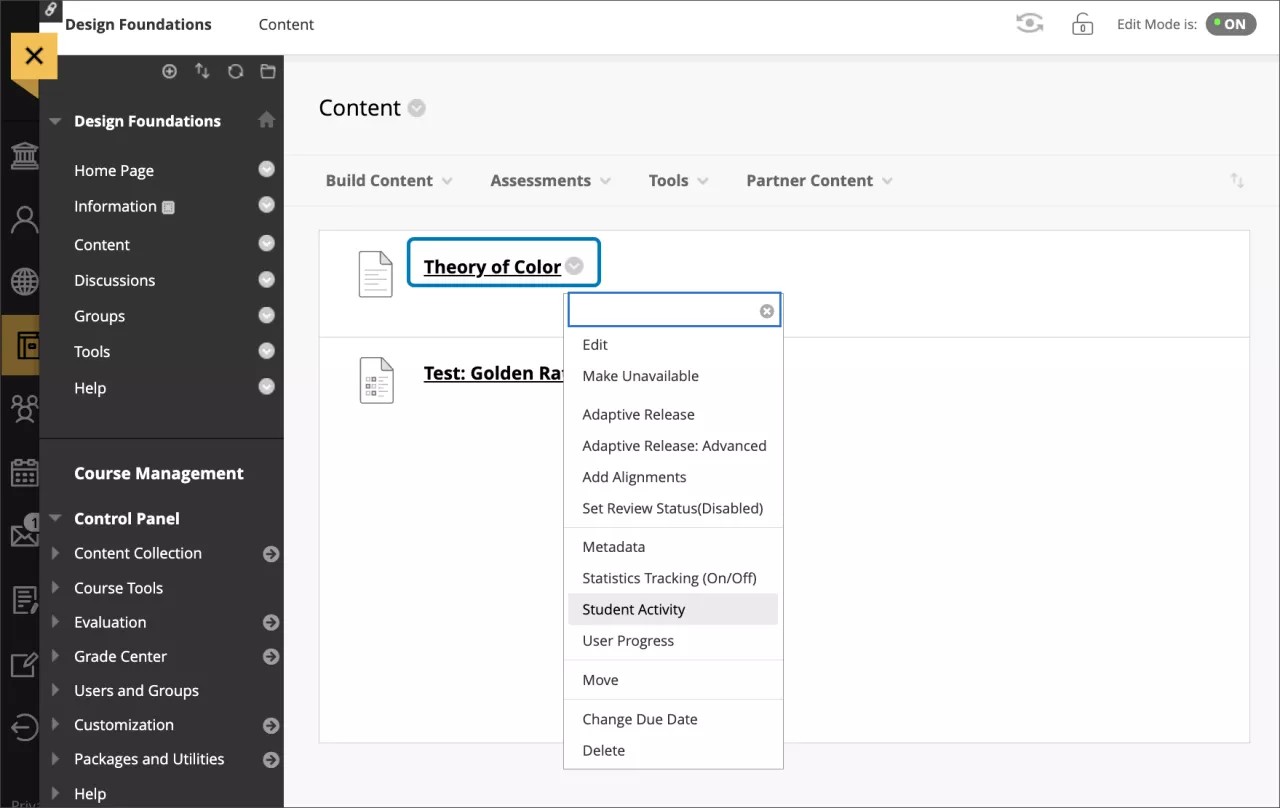
In Original, you can access student activity details by selecting the arrow menu beside an assessment on the Content page.
Student activity details aren’t available for anonymous graded assessments. When you turn off the anonymous grading option, the Student Activity Details Report for Assessments appears again.
Explore student activity details
The top of the page shows you an overview of information, including the course average submission time and time before due date.
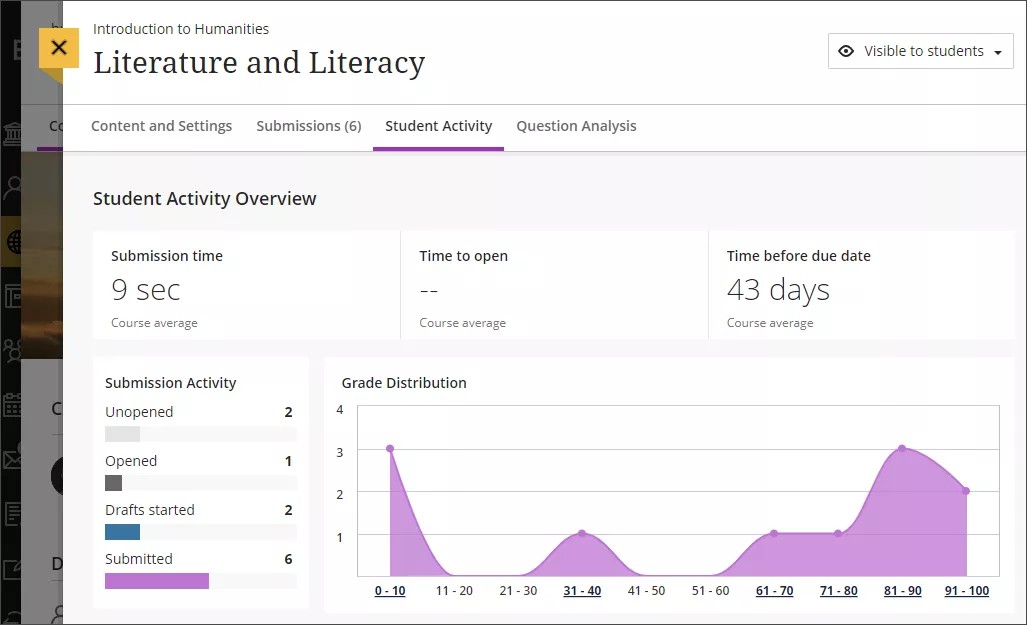
Submission Activity
The Submission Activity section includes the number of students at specific stages in the assessment. The stages include:
- Unopened
- Opened
- Drafts started
- Submitted
Grade Distribution
The Grade Distribution line graph shows student grades.
The x axis represents grade ranges. Ranges are from the lowest to the maximum possible grade for the assessment.
The y axis is the number of students who received a specific grade.
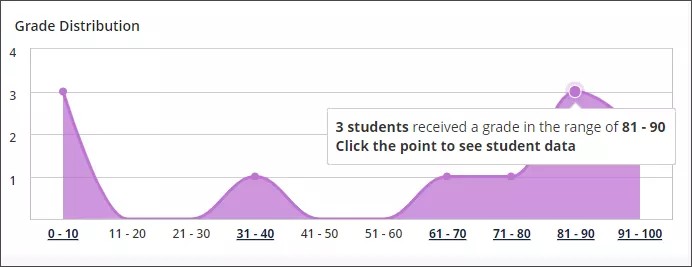
Select any dot on the line graph to see more information about the students who received a grade in that specific range. Student grades are displayed as columns in a bar graph. Hover over the student’s column to see the student’s name, grade, and percentile.
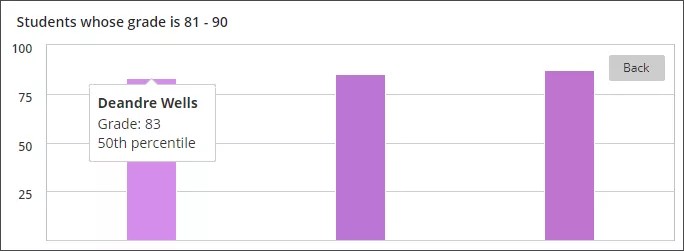
To return to the Grade Distribution line graph, select the Back button.
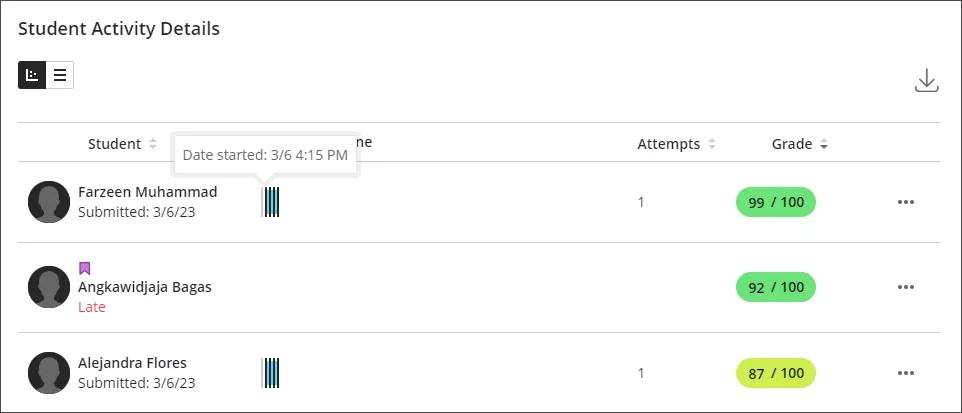
Table and chart views
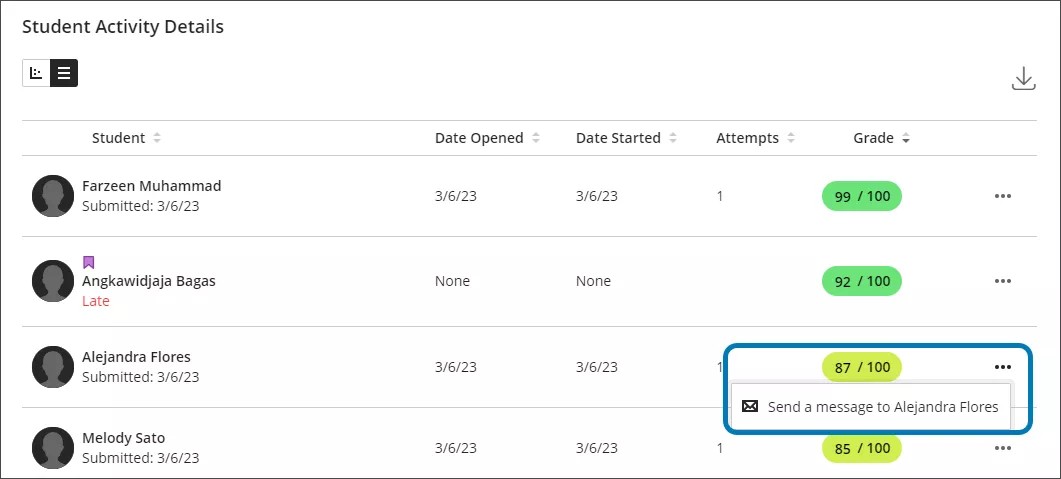
The bottom half of the Student Activity Details report includes individual student activity, including students’ names, activity timeline, start to finish time, and grade. Students who submitted the assessment late have a red circle around their profile picture and the associated submission text is red. Students with accommodations, such as being exempt from time limits or due dates on assessments, have a purple flag by their name. Visit the "Navigate Grading" topic to learn more about accommodations for assessments.
Chart view
The chart view displays an Activity Timeline in a visual, box-and-whisker plot graph. Hover over the tick marks on the plot to see important markers of student activity.
The Activity Timeline includes:
- Date opened
- Date started
- Draft saved
- Submitted
There are also columns for Attempts and Grade.
The chart view is unavailable on small devices and the Blackboard App.
Table view
The table view presents information in five columns.
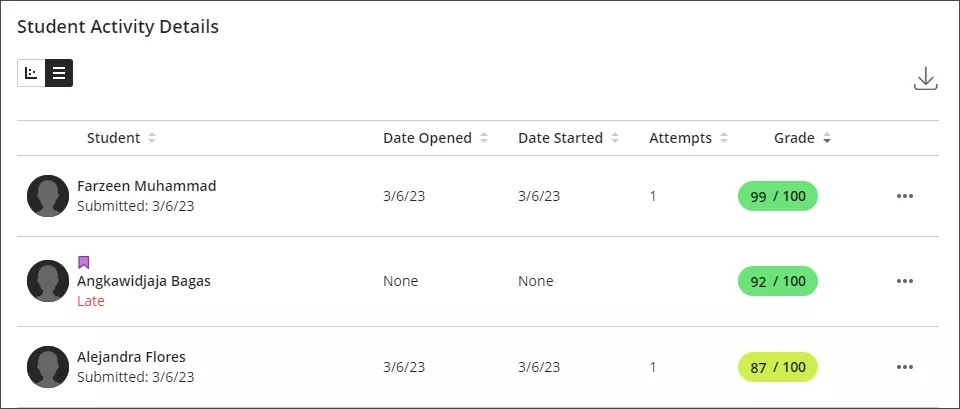
The columns include:
- Student
- Date Opened
- Date Started
- Attempts
- Grade
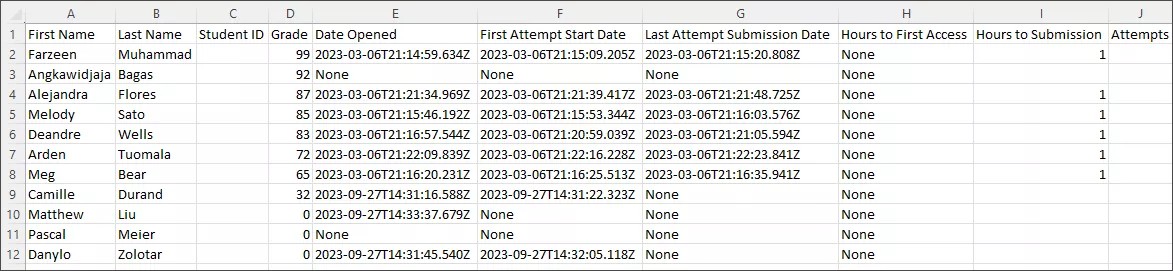
Select the Download button to download the data as a comma-separated values (CSV) file for all your students.
The CSV includes:
- First Name
- Last Name
- Student ID
- Grade
- Date Opened
- First Attempt Start Date
- Last Attempt Submission Date
- Hours to First Access
- Hours to Submission
- Attempts
Contact a student
You can send a message to any student from either view in Ultra. Select the More options icon to send a message to one of your students. Invite the student to meet with you one-on-one or during office hours to discuss their activity in the course. In Original, the More options menu to send messages doesn't appear and you must use regular message options inside the course.