You can view statistical information about your tests and surveys.
Statistics help you evaluate the effectiveness of your tests and surveys. For example, find out what percentage of your students chose each Multiple Choice answer for one of your tests.
In this table, learn about the available reports and their uses.
| Statistical Report | Information Provided | Feature |
|---|---|---|
| Column Statistics | Displays the overall class performance on the Grade Center item that includes average score and standard deviation. Lists the number of submissions for the item that are in progress or need grading. |
Tests Surveys Assignments Graded discussions, wikis, blogs, journals |
| Attempts Statistics | Displays the average score and distribution of student responses for each question. | Tests Surveys |
| Item analysis | Provides statistics on overall test performance and individual questions. This data identifies questions that might be poor discriminators of student performance. You can use this information to improve questions for future test administrations or to adjust credit on current attempts. This tool contains some of the same information as the column and attempts statistics data but presents it in a different way. |
Tests |
View column statistics
For each test and survey in the Grade Center, you can view column statistics on overall class performance:
- Statistics, such as standard deviation and the average score
- How many attempts are in progress, need grading, or are exempt
- Grade distribution
You can use this information for a rapid analysis of how well your students learned the material. You can also compare the performance of the current class to other sections or previous terms.
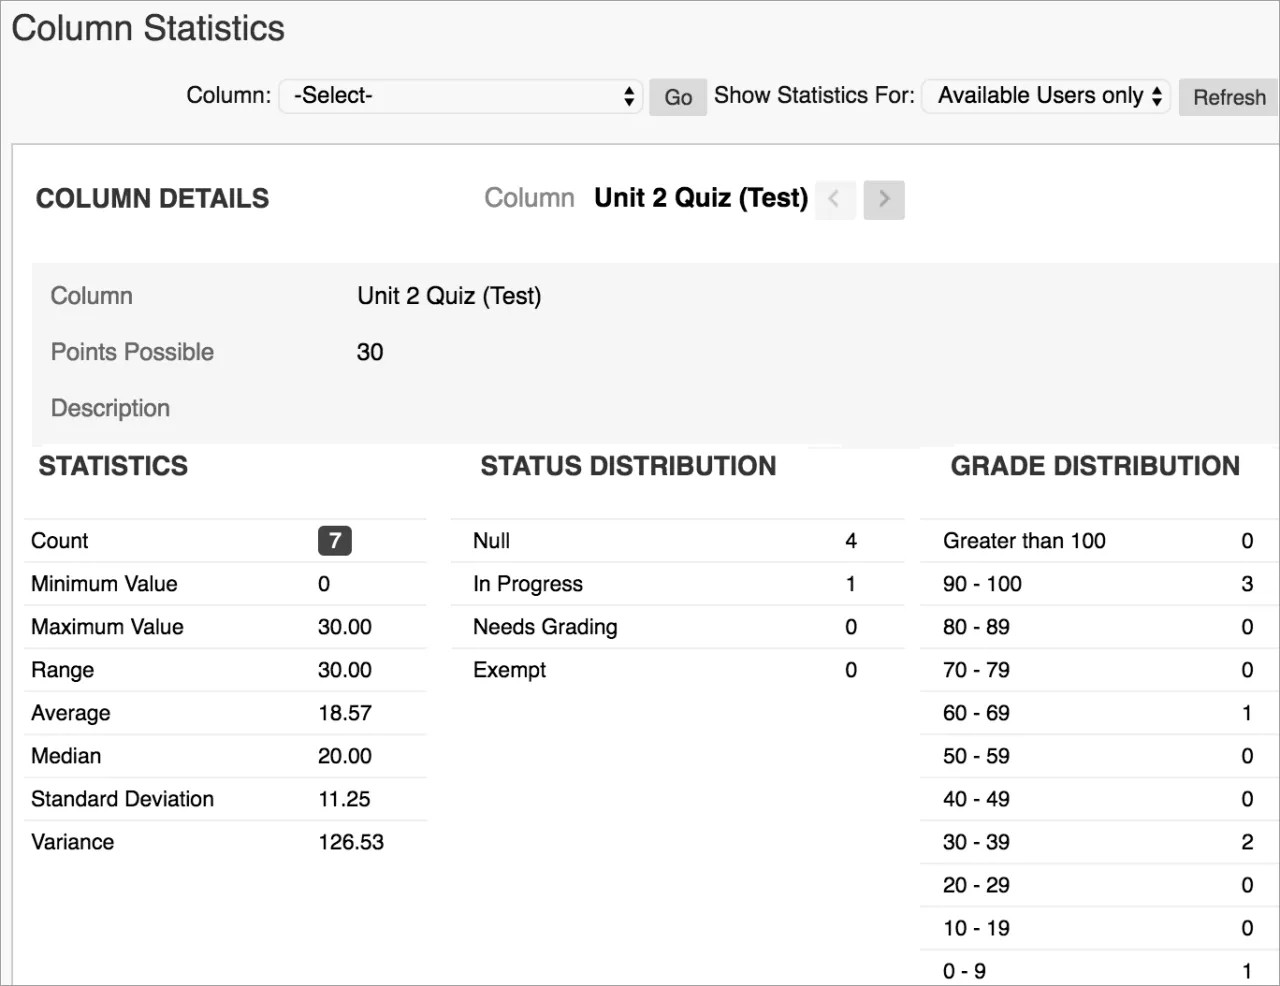
In the Grade Center, select Column Statistics from the test or survey column's menu. The Column Statistics page appears and you can review the statistics for these:
Count: The number of tests graded or surveys completed.
Minimum Value: The lowest score on the test.
Maximum Value: The highest score on the test.
Range: This range of scores provides a basic measure of variability of test scores.
Average: The sum of all scores divided by the number of scores.
Median: The score at the midpoint of the grade distribution. An equal number of scores fall above or below this score.
Standard Deviation: The measure of how far the scores deviate from the average score.
Variance: The measure of score dispersion—the square root of the variance is the standard deviation.
Because surveys don't have a value, zero appears for some of the survey statistics.
View attempts statistics
Attempts statistics show you how students fared on each question. The overall quality of a test depends on the quality of the individual questions. Use these statistics to determine if content was unclear or questions were misinterpreted.
You can also use attempts statistics to view survey results.
- From the Grade Center, navigate to a test or survey's column.
- Access the column's menu and select Attempts Statistics. The results display on the Statistics page.
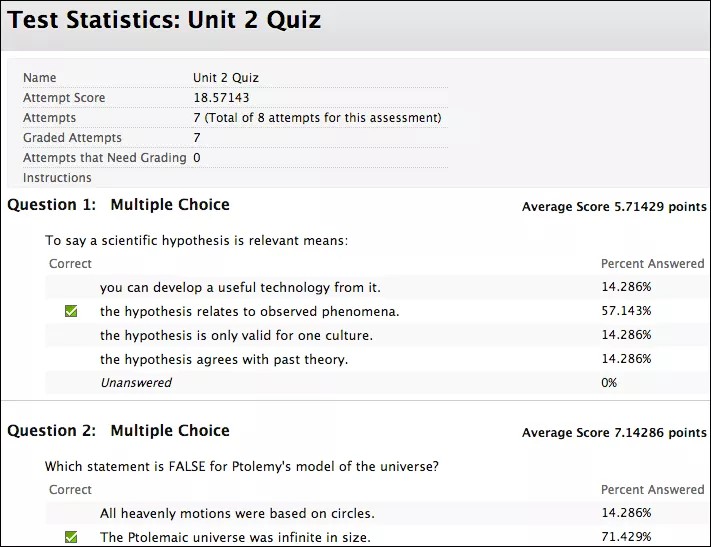
This information is provided:
- Average score for each question
- Number of graded student attempts
- Number of unanswered responses
- Distribution of student responses for each question
Each possible answer is shown with a percentage or response rate. For a Multiple Choice question, a high response rate to a particular incorrect answer may indicate a common misconception among students. Or, you might have chosen the incorrect answer when you created the question. A high response rate to an incorrect answer may also indicate you worded a question poorly.
Because surveys are anonymous, you can't view any student's individual answers. If you included an open-ended Essay question in the survey, all responses are listed.
Download results
In the Grade Center, each test or survey column's menu also has a Download Results option. You can compile the questions and answers in a spreadsheet to review offline.
When you download test results, the spreadsheet includes the students' names and usernames. Unlike tests, surveys are intended to gather opinions from students where they can reply honestly because their anonymity is protected. As a result, when you download survey results, the results won't include any information that identifies each student.
Downloaded test and survey results don't include statistical information.
Formatting options
When you download information, you can select the delimiter type for the downloaded results for the test or survey. Comma-delimited files (CSV) have data items separated by commas. Tab-delimited files (TXT) have data items separated by tabs.
You can add .txt to the downloaded file name and then import it into a spreadsheet application to view it.
If you pasted test or survey information from an HTML or Word document when you created your questions and answers, you may see HTML code in your spreadsheet.