Nämä tiedot koskevat vain alkuperäistä kurssinäkymää. Oppilaitoksesi määrittää, mitkä työkalut ovat käytettävissä.
Item analysis provides statistics on overall performance, test quality, and individual questions. This data helps you recognize questions that might be poor discriminators of student performance.
Uses for item analysis:
- Improve questions for future test administrations or to adjust credit on current attempts
- Discuss test results with your class
- Provide a basis for remedial work
- Improve classroom instruction
Example:
After the item analysis, you notice that the majority of students answer one question incorrectly. Why the low success rate?
- Is the wording of the question confusing?
- Are the answer options unclear?
- Were students given the right content to learn to successfully answer this question?
- Was the content to learn easily accessible and clear?
Based on what you discover, you can improve the test question so it truly assesses what students know or don't know.
Watch a video about item analysis
The following narrated video provides a visual and auditory representation of some of the information included on this page. For a detailed description of what is portrayed in the video, open the video on YouTube, navigate to More actions, and select Open transcript.
Video: Using Item Analysis in Blackboard Learn explains how to access and run item analysis, view statistics, and edit a test question.
Run an item analysis on a test
You can run an item analysis on a deployed test with submitted attempts, but not on a survey.
The test can include single or multiple attempts, question sets, random blocks, auto-graded question types, and questions that need manual grading. For tests with manually graded questions that you haven't assigned scores for, statistics are generated only for the scored questions. After you manually grade questions, run the analysis again. Statistics for the manually graded questions are generated and the test summary statistics are updated.
For best results, run an analysis on a test after students have submitted all attempts, and you've graded all manually graded questions. Be aware that the statistics are influenced by the number of test attempts, the type of students who took the test, and chance errors.
- Roles with grading privileges—instructors, graders, and teaching assistants—access item analysis in three locations within the test workflow.
- A test deployed in a content area
- A deployed test listed on the Tests page
- A test's Grade Center column
- Access the test's menu and select Item Analysis.
- In the Select Test menu, select a test. Only deployed tests are listed.
- Select Run.
- Select the new report's link in the Available Analysis section or select View Analysis in the status receipt at the top of the page.
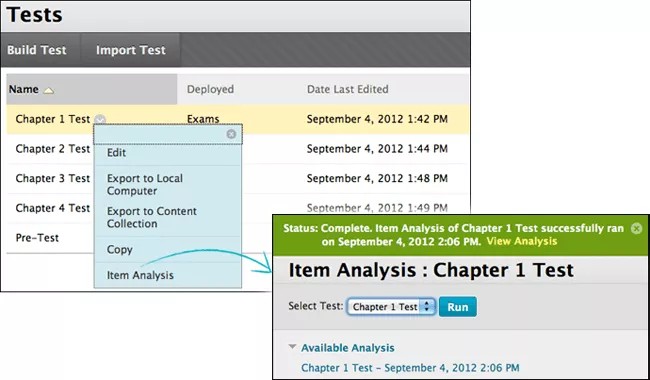
You can access a previously run analysis in the Available Analysis section.
Test summary on the Item Analysis page
The Test Summary provides data on the test as a whole.
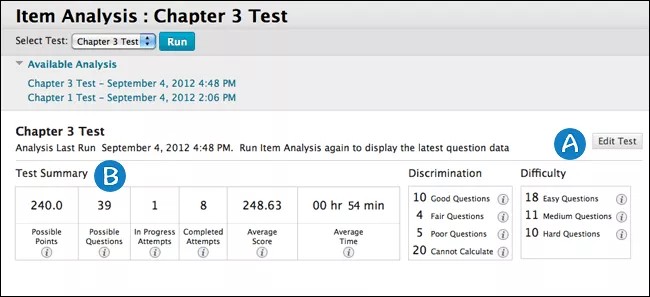
- Edit Test provides access to the Test Canvas where you can make changes to the test.
- View test statistics:
- Possible Points: The total number of points for the test.
- Possible Questions: The total number of questions in the test.
- In Progress Attempts: The number of students currently taking the test who haven't submitted it yet.
- Completed Attempts: The number of submitted tests.
- Average Score: Scores denoted with an asterisk indicate that some attempts aren't graded and that the average score might change after all attempts are graded. The score shown is the average score reported for the test in the Grade Center.
- Average Time: The average completion time for all submitted attempts.
- Discrimination: Shows the number of questions that fall into the Good (greater than 0.3), Fair (between 0.1 and 0.3), and Poor (less than 0.1) categories. A discrimination value is listed as Cannot Calculate when the question's difficulty is 100% or when all students receive the same score on a question. Questions with discrimination values in the Good and Fair categories are better at differentiating between students with higher and lower levels of knowledge. Questions in the Poor category are recommended for review.
- Difficulty: Shows the number of questions that fall into the Easy (greater than 80%), Medium (between 30% and 80%) and Hard (less than 30%) categories. Difficulty is the percentage of students who answered the question correctly. Questions in the Easy or Hard categories are recommended for review and are indicated with a red circle.
Only graded attempts are used in item analysis calculations. When attempts are in progress, those attempts are ignored until they're submitted and you run the analysis report again.
Question statistics table on the Item Analysis page
The question statistics table provides item analysis statistics for each question in the test. Questions that are recommended for your review are indicated with red circles so you can quickly scan for questions that might need revision.
In general, good questions fall in these categories:
- Medium (30% to 80%) difficulty
- Good or Fair (greater than 0.1) discrimination values
In general, questions recommended for review fall in these categories. They may be of low quality or scored incorrectly.
- Easy ( > 80%) or Hard ( < 30%) difficulty
- Poor ( < 0.1) discrimination values
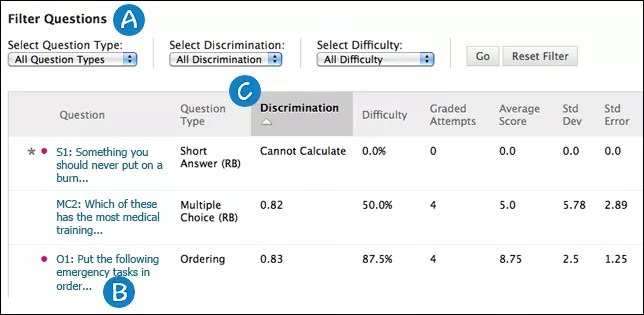
- Filter the question table by Question Type, Discrimination, and Difficulty.
- To investigate a specific question, select the title and review the Question Details page.
- Statistics for each question appear in the table:
- Discrimination: Indicates how well a question differentiates between students who know the subject matter and those who don't. A question is a good discriminator when students who answer the question correctly also do well on the test. Values can range from -1.0 to +1.0. A question is flagged for review if its discrimination value is less than 0.1 or negative. Discrimination values can't be calculated when the question's difficulty score is 100% or when all students receive the same score on a question.
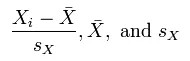
Discrimination values are calculated with the Pearson correlation coefficient. X represents the scores of each student on a question and Y represents the scores of each student on the test.
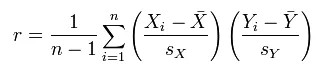
These variables are the standard score, sample mean, and sample standard deviation, respectively:
- Difficulty: The percentage of students who answered the question correctly. The difficulty percentage is listed along with its category: Easy (greater than 80%), Medium (30% to 80%), and Hard (less than 30%). Difficulty values can range from 0% to 100%, with a high percentage indicating that the question was easy. Questions in the easy or hard categories are flagged for review.
Difficulty levels that are slightly higher than midway between chance and perfect scores do a better job differentiating students who know the tested material from those who don't. High difficulty values don't assure high levels of discrimination.
- Graded Attempts: Number of question attempts where grading is complete. Higher numbers of graded attempt produce more reliable calculated statistics.
- Average Score: Scores denoted with an asterisk indicate that some attempts aren't graded and that the average score might change after all attempts are graded. The score that appears is the average score reported for the test in the Grade Center.
- Standard Deviation: Measure of how far the scores deviate from the average score. If the scores are tightly grouped, with most of the values close to the average, the standard deviation is small. If the data set is widely dispersed, with values far from the average, the standard deviation is larger.
- Standard Error: An estimate of the amount of variability in a student's score due to chance. The smaller the standard error of measurement, the more accurate the measurement provided by the test question.
- Discrimination: Indicates how well a question differentiates between students who know the subject matter and those who don't. A question is a good discriminator when students who answer the question correctly also do well on the test. Values can range from -1.0 to +1.0. A question is flagged for review if its discrimination value is less than 0.1 or negative. Discrimination values can't be calculated when the question's difficulty score is 100% or when all students receive the same score on a question.
View question details for a single question
You can investigate questions that are flagged for your review and view student performance.
On the Item Analysis page, scroll to the question statistics table. Select a linked question title to access the Question Details page.
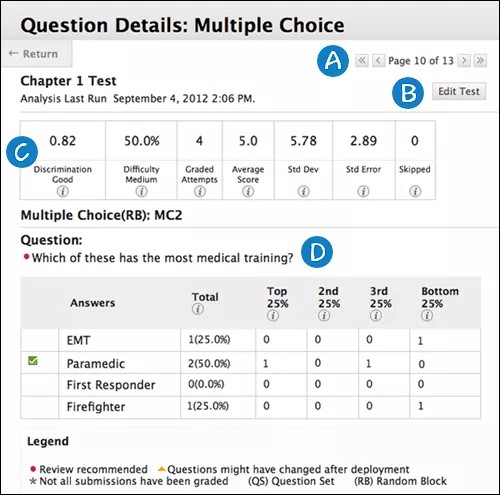
- Use the Previous Page and Next Page icons to page through questions sequentially. You can also skip to the first or last question.
- Select Edit Test to access the Test Canvas where you can make changes to the test.
- The summary table displays statistics for the question. You can review the descriptions for each statistic in the previous section.
- The question text and answer choices appear. The information varies based on the question type:
| Type of Information Provided | Question Types |
|---|---|
| Number of students who selected each answer choice -AND- Distribution of those answers among the class quartiles |
Multiple Choice Multiple Answer True/False Either/Or Opinion Scale/Likert |
| Number of students who selected each answer choice | Matching Ordering Fill in Multiple Blanks |
| Number of students who got the question correct, incorrect, or skipped it | Calculated Formula Calculated Numeric Fill in the Blank Hot Spot Quiz Bowl |
| Question text only | Essay File Response Short Answer Jumbled Sentence—also includes the answers students chose from |
Symbol legend
Symbols appear next to the questions to alert you to possible issues.
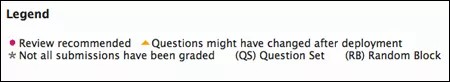
- Review recommended: Triggered when discrimination values are less than 0.1. Also, when difficulty values are either greater than 80% (question was too easy) or less than 30% (question was too hard). Review the question to determine if it needs revision.
- Question may have changed after deployment: Indicates that a part of the question changed after the test was deployed. A change could mean that the data for that question might not be reliable. Attempts submitted after the question was changed may have benefited from the change.
This indicator doesn't appear for restored courses.
- Not all submissions have been graded: Appears for a test containing questions that require manual grading, such as Essay questions. In a test that contains an Essay question with 50 student attempts, this indicator shows until you grade all 50 attempts. The analysis uses only attempts you've graded at the time you run the report.
- (QS) and (RB): Indicate that a question came from a question set or random block. Due to random question delivery, some questions may have more attempts than others.
Multiple attempts, question overrides, and question edits
The analysis handles multiple attempts, overrides, and other common scenarios in these ways:
- When students take a test multiple times, the last submitted attempt is used as the input for the analysis. For example, for a test with three attempts, Student A completes two attempts and has a third attempt in progress. Student A's current attempt counts toward the number listed for In Progress Attempts. None of Student A's previous attempts are included in the current analysis data. As soon as Student A submits the third attempt, subsequent analyses will include Student A's third attempt.
- Grade Center overrides don't impact the analysis data because the analysis generates statistical data for questions based on completed student attempts.
- Manually graded questions or changes made to the question text, correct answer choice, partial credit, or points don't update automatically in the analysis report. Run the analysis again to see if the changes affected the data.
Examples
Item analysis can help you improve questions for future test administrations. You can also fix misleading or ambiguous questions in a current test.
- A Multiple Choice question is flagged for your review. More Top 25% students chose answer B, but A is the correct answer. You realize you didn't choose the correct answer when you created the question. You edit the test question and it's automatically regraded.
- In a Multiple Choice question, an equal number of students chose A, B, and C. Examine the answer choices to determine if they're ambiguous, if the question is too difficult, or if the material wasn't covered.
- A question is recommended for review because it falls into the hard difficulty category. You determine the question is hard, but you keep it to adequately test your course objectives.