After the recipients have responded to the survey, you can look at individual responses or analyze the results to view an aggregation of the responses. Analyzing the results generates a report that can summarize each response period individually or show results parsed by the criteria you selected.
View Enterprise Survey submissions
- Go to the Enterprise Surveys page to view a list of all surveys.
- For a survey, select the number of corresponding response groups. Alternatively, you can open a survey's menu and select Response Periods.
- On the Response Periods page, select the Submissions Received number for a response period.
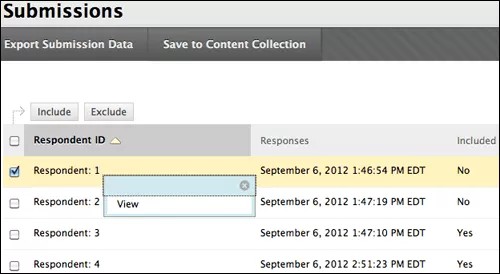
- The Submissions page lists all respondents. If the survey was anonymous, the respondent ID is a number. If the survey was not anonymous, the respondent is identified by name.
- Open a Respondent ID's menu.
- Select View to display responses in a new window.
Analyze results of an Enterprise Survey
- Go to the Enterprise Surveys page to view a list of all surveys.
- For a survey, select Analyze Results to view the survey responses.
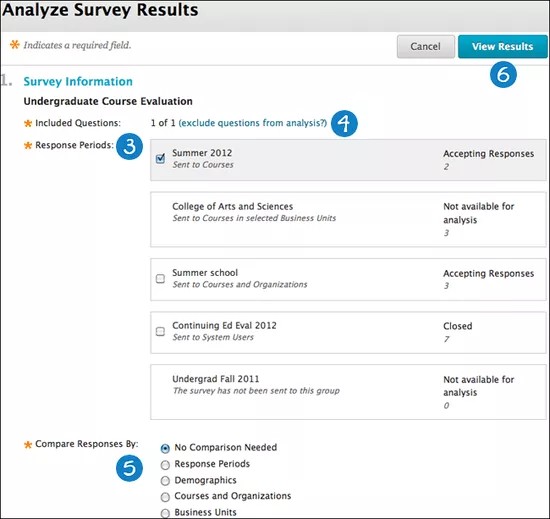
- Select one or more response periods.
- Select questions to exclude from the analysis, if needed.
- In the Compare Responses By area, select No Comparison Needed to view each response period summary and the aggregated detailed question results -OR- select comparison criteria to view results parsed by that criteria.
- Select View Results.
Compare responses
You can select from several criteria to compare survey responses:
- Response Period - Select multiple response periods. Each response period displays as a separate bar in the report. If the response periods use different methods to select recipients, you might not be able to make comparisons. For example, if the survey had one response period based on uploaded email addresses and one based on course enrollment, you cannot make comparisons based on demographics because the email addresses do not include that information.
- Demographics - To compare survey responses by demographics, your response periods cannot accept anonymous responses. There also needs to be demographic information available in the system. If your institution collects demographic information in user accounts, it can be used to analyze responses as long as they are not anonymous.
- Courses and Organizations - To compare survey responses by courses and organizations, the response periods need to include that information. For example, you can send an undergraduate course evaluation to all students enrolled in courses that were taught in the fall term. You can compare the responses of all courses and organizations, or you can select specific ones. If your institution licenses Community Engagement, you can also include Business Unit Averages if these places have been created and courses are affiliated with them. Your institution must also have created an institutional hierarchy and affiliated users, and courses to the places or locations in the hierarchy, called nodes. The response periods need to include the name of the business unit (node).
- Specified Survey Question - To compare survey responses by question, select the question you want to use.
View results for an Enterprise Survey
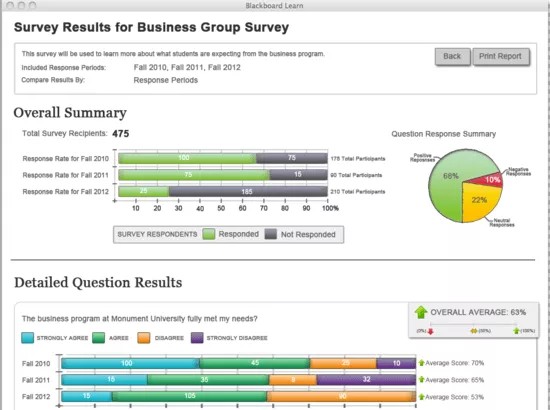
Survey results are generated in a report. The top of the report summarizes the response periods included in the report and how the results are compared. An overall summary of the response rate for the response periods appears next. A pie chart displays the percentages of positive and negative responses.
Detailed results for each question are provided. If you have added points to question responses, you can see the average for each response.
Open response questions appear at the bottom of the report. Expand the section to read each response.
Select Print Report to generate a PDF version of the report that opens in a new window.You can save the PDF file or print it. If the survey has open entry questions, you can print the report with or without those questions.
Export submission data
You can export submission data as a .csv file so that it can be imported it into a third party analysis tool. You can compare different surveys by exporting their associated response period submissions data and then importing that data into a third-party tool.
- On the Enterprise Surveys page, locate the desired survey.
- Select a number in the Response Group column.
- On the Response Periods page, select the response periods you want to export.
- Select Export Submission Data.
- Select the delimiter to separate the data fields. You can choose tab or comma.
- You can include responses that you excluded in the survey results.
- Select Download.
Release results to instructors
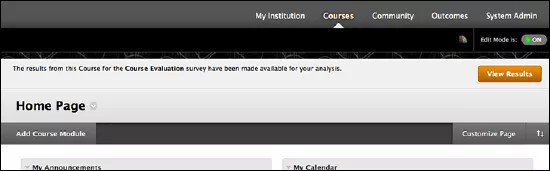
If you need to release survey results to instructors, select recipients using the Places option when creating the survey response period. A release survey results section appears on the survey scheduling tab. Check Release Survey Results to release the results to instructors. When results are released to instructors, a banner appears in their course with a View Results button for them to access the results.
If you did not select recipients using the Places option, all reports can be saved and manually distributed.