Collaboration Session Activity report
Continuous Delivery | Release to Production 25 June 2020
New features, Reporting
This feature is only available to participants of the Blackboard Data Insider Program. For more information about the program & eligibility, please visit Blackboard Data Insider Program.
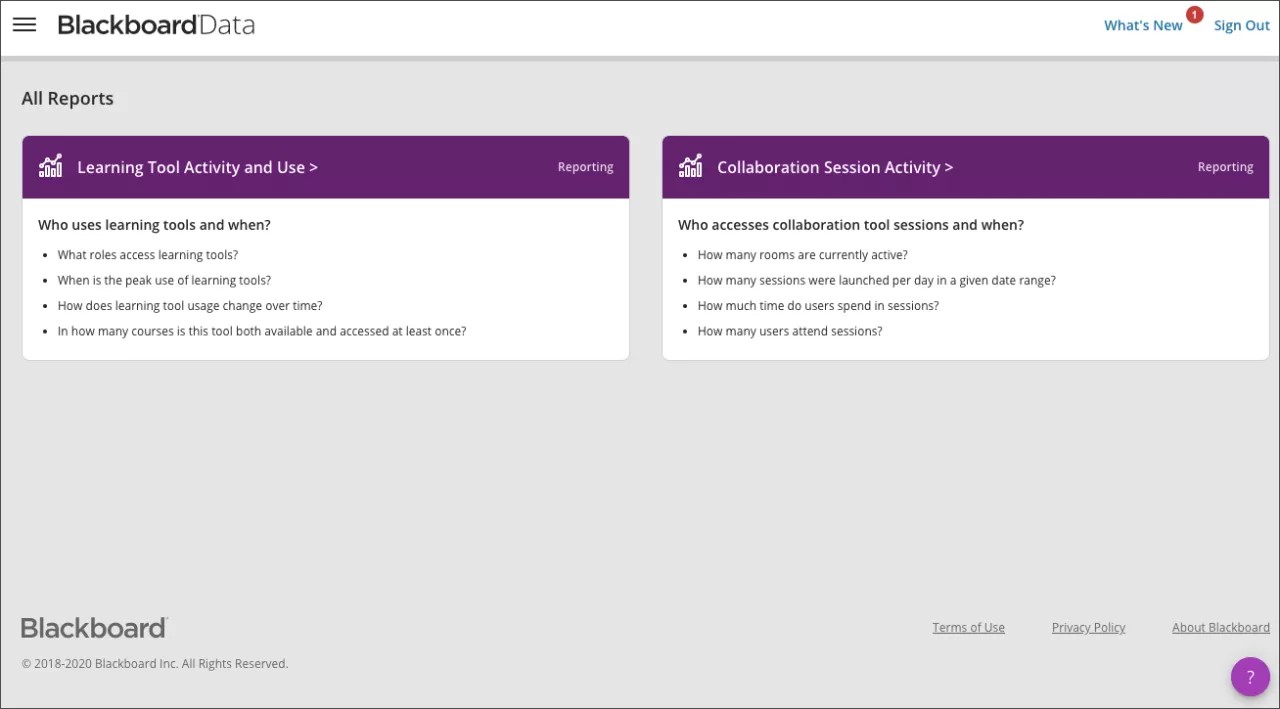
The new Collaboration Session Activity report allows users to see who accesses their collaboration tool sessions and when they are accessing them. The initial release of this report helps users understand:
- How many rooms are currently active?
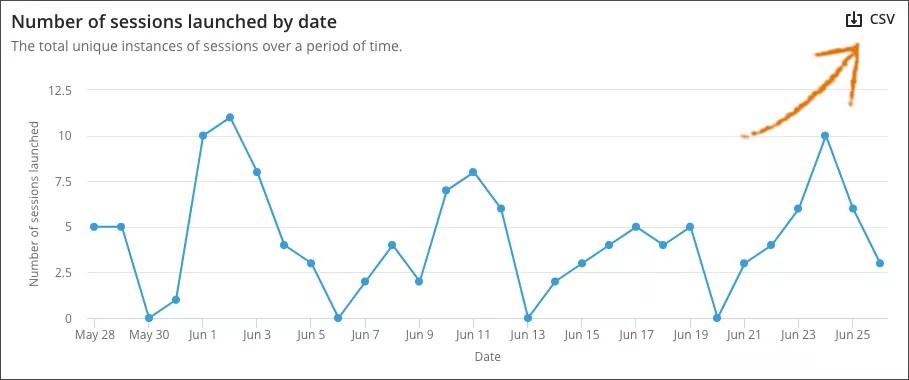
- How many sessions were launched per day in a given date range?
- How much time do users spend in sessions?
- How many users attend sessions?
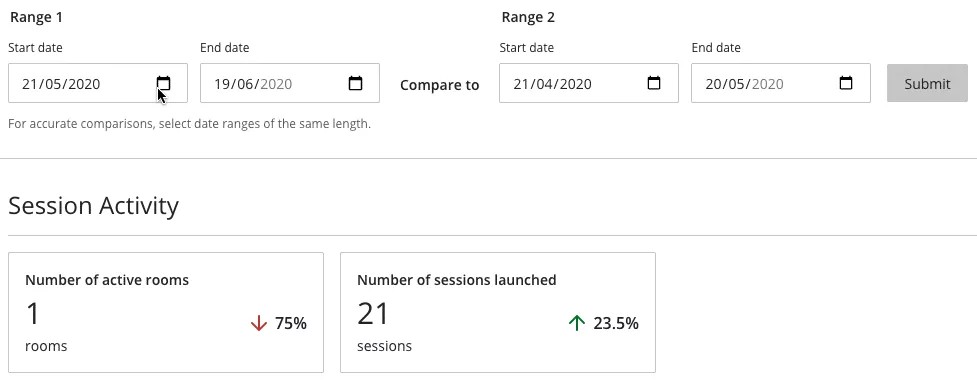
Date Filtering
- Range 1 is the main date range that is shown on the metrics and visualizations. Users can select any length starting with the same day.
- Range 2 is the comparative date range, used to compare with Range 1. The percentage changes on the numeric (Level 1) metrics are calculated by comparing Range 1 to Range 2.
- We recommend selecting date ranges of the same length for accurate comparisons.
Export to CSV
Users can export the data from the "Number of sessions launched by date" chart into CSV format for external consumption.