Your institution controls which tools are available in the Original Course View. The gradebook is always available to instructors in the Ultra Course View.
About calculated columns
In the Grade Center, you can calculate grades with calculated columns. Calculated columns combine data from multiple columns to attain performance results. You can share these results with students and your institution.
You can include a calculated column when you create another calculated column. For example, if you created a calculated column that weighs quiz grades, you can include the column when you create a final grade column.
For more information, open a calculated column header's menu and select Quick Column Information. For calculated columns, Points Possible includes the phrase (may vary by student) because some students may be exempt from a test or assignment. Some students may not submit all of the items included in the column's calculation.
You can change a calculated column's settings and change what is included. The calculation updates automatically.
A calculated column with text as the grade display is not included in the column's calculation. For example, if you set a column to display text, such as Satisfactory/Unsatisfactory, you can't use it in grade calculations.
You can't type in a calculated column's cell to edit the calculated grade. No menu appears in the individual cells.
By default, the system creates two calculated columns that appear in new courses—total and weighted total.
Why do grade values include decimal points?
About the total column
The total column generates a grade based on the cumulative points earned, related to the points allowed. You can select which columns and categories are included in a total column's calculation. When you create a total column, you can include other calculated columns.
A total column is created by default and appears in new courses. You can rename, change the settings, change which columns are included, or delete the column.
Total points formula
Add the points possible of all selected columns to find the total points. Then, add a student's earned scores for all selected columns. The result is the total earned out of the total points possible. Exempted items are ignored. The result displays according to the Primary and Secondary Display options.
Column 1 points earned + Column 2 points earned + Column 3 points earned + Column 4 points earned = Total points earned out of total points possible
Example: Student A
Eight values: 8/10, 3/5, 2/2, 3/7, 47/50, 20/25, 88/100
Earned points value: 171
Points possible value: 199
Total points: 171/199
Create total columns
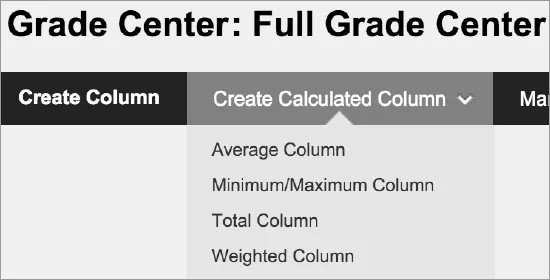
- In the Grade Center, open the Create Calculated Column menu and select Total Column.
- On the Create Total Column page, type a brief name and an optional description. The name becomes the column name in the Grade Center and on students' My Grades pages. If the name is too long to display clearly in the Grade Center, add a shorter name in the Grade Center Name box. Only the first 14-15 characters appear in the column heading in the Grade Center grid.
- Make a selection in the Primary Display menu. The selection is the grade format shown in the Grade Center and to students in My Grades. If you created custom grading schemas, they appear in the list. Five default options appear:
- Score: A numeric grade is the default setting. If you don't make a selection, the score appears in the grid.
- Letter: A letter grade appears. The default grading schema is used to assign letter grades. For example, a score of 21/30 equals 70% and appears as a C.
- Text: Text appears in the column when you create and associate a text grading schema. Examples of text values include: Excellent, Very Good, Good, Fair, and Poor -OR- Satisfactory and Unsatisfactory. If no text grading schema exists, and you select the Text option, you can type text in the column's cells. If you choose to share the column results with students in My Grades, they see the text values for their grades.
You can convert a numeric score to text. But, if you don't create a custom text grading schema, and return to numeric scoring, values that can't be converted display a zero after conversion. If you want to include text as grades, we recommend that you create a text grading schema and associate it with the appropriate columns.
- Percentage: A percentage appears. For example, a score of 21/30 appears as 70%.
- Complete/Incomplete: When a student submits an item, a Completed icon appears in the column regardless of the score achieved.
- Optionally, make a selection in the Secondary Display menu. The default setting is None. In the Grade Center column, the secondary value appears in parentheses. The secondary value doesn't appear to students.
- If grading periods exist, you can associate the column with a grading period. If no grading periods exist, the menu doesn't appear. You can use grading periods to filter Grade Center data and create calculated columns.
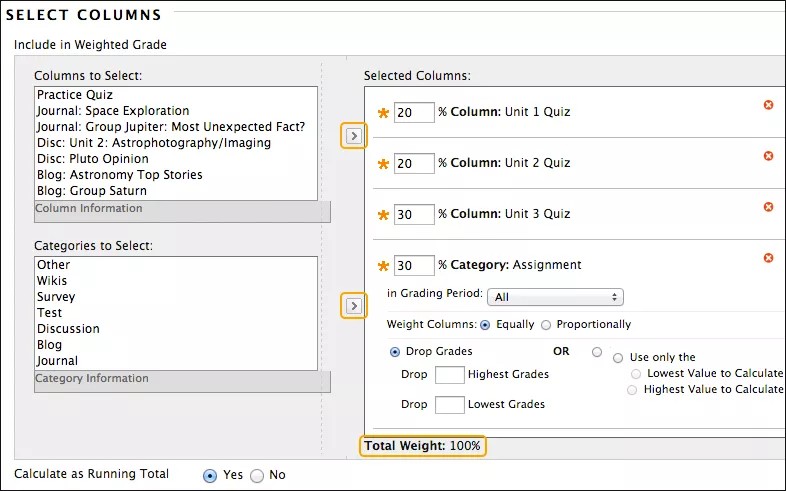
- In the Select Columns section, select what to include in the column's calculation. This table lists the column options.
Column Options Option Description All Grade Columns Include all individual grade columns in the Grade Center. All Grade Columns in Grading Period Select a grading period from the menu to include only those columns associated with the grading period in the calculation. If no grading periods exist, the menu doesn't appear. Selected Columns and Categories Select grade columns and categories individually.
Select the columns in the Columns to Select box and select the right-pointing arrow to move the selections to the Selected Columns box. A column that is set to No for Include this Column in Grade Center Calculations doesn't appear in the selection list.For Windows, to select multiple items in a list, press the Shift key and select the first and last items. To select items out of sequence, press the Ctrl key and select each item needed. For Macs, press the Command key instead of the Ctrl key.
Select the categories in the Categories to Select box and select the right-pointing arrow to move the selections to the Selected Columns box. When you select a category, you can view which columns are included in the category in the Category Information area below the Categories to Select box. Other options appear after you move the category to the Selected Columns box:- If grading periods exist, make a selection in the Grading Period menu.
- Drop Grades removes a number of either the highest or lowest grades for each category from the calculation. If you don't type numbers in the boxes, no grades are dropped.
- Use only the Lowest -OR- Highest Value to Calculate removes all grades from the calculation except for the best or worst score.
To delete a selection in the Selected Columns box, select the red X.
- Calculate as Running Total: Select Yes to calculate as a running total. Running totals exempt cells that don't contain data. Select No to include all selected columns in the calculation, using a value of 0 if no grade exists. The result can make grades appear artificially low.
- Select the Options:
- Include this Column in Grade Center Calculations: Select Yes to make the column available for potential inclusion when creating calculated columns.
- Show this Column to Students: Select Yes to display the column to students in My Grades.
- Show Statistics (average and median) for this Column to Students in My Grades: Select Yes to include statistical information with the grade value when shown to students.
- Select Submit.
If you delete a column from the Grade Center that is included in a total calculation, the column is also removed from the calculation.
About weighted columns
The weighted column generates a grade based on the result of selected columns and categories, and their respective percentages. When you create a weighted column, you can include other calculated columns and other weighted columns.
A default weighted total column appears in new courses. You can rename it, change the settings, change which columns and categories are included, or delete this column. The default weighted total column displays no results until you select the columns and categories to include in the calculation. This column is included in the Final Grade View smart view.
Weighted totals are calculated based on percentages and not based on grading schemas/letter grades. Columns included in the weighted total aren't displayed using the same grading schema as the input grade values. Grading schemas map a range of percentages to a particular label for display purposes. Schemas don't have an impact on the weighted total's underlying calculations, which are based on percentages or points/points possible.
When extra credit is combined with a weighted total column, points are added to the achieved weighted score. The achieved weighted score is then divided by weighted points possible to produce a percentage. Read more about extra credit with weighted total columns.
Weighted column in action
Example: Weighted final grade for the year
You can create any number of weighted columns, including weighted columns that include other weighted columns. You can create a weighted column that uses the quarters' weighted columns and the final test grade columns to calculate a final grade.
(Quarter 1 = 15%) + (Quarter 2 = 20%) + (Quarter 3 = 15%) + (Quarter 4 = 20%) + (2 semester tests = 30%) = (Year final grade*)
*In a new course, the default total column is the default external grade column, but you can set any column as the external grade. The external grade is the grade reported to your institution.
More on the external grade column
How Learn calculates weighted totals for calculated columns
You can customize your gradebook using weights so certain coursework contributes to a student’s overall score more than other coursework.
Weights are useful but can be complicated. In this example, we outline how Blackboard Learn calculates a column total when each item carries a different weight.
Example: Your course includes five tests, but the last test is a final exam and needs to carry more weight in the group than the other tests when the final grade is calculated for this column.
Tests 1-4 are each worth 15% and the final exam is worth 40%. The tests are also each worth different point values, as shown below.
| Item name | Possible points | Item weight |
|---|---|---|
| Test 1 | 30 points | 15% |
| Test 2 | 30 points | 15% |
| Test 3 | 60 points | 15% |
| Test 4 | 60 points | 15% |
| Final Exam | 100 points | 40% |
| 280 points | 100% |
So how is the column’s possible points calculated? We have to apply the weight to both the student’s score as well as the total possible points.
First, consider how many achievable points there are in this column, based on the weight.
- Test 1: 30 points x .15 = 4.5
- Test 2: 30 points x .15 = 4.5
- Test 3: 60 points x .15 = 9
- Test 4: 60 points x .15 = 9
- Final exam: 100 points x .4 = 40
The sum of all possible weighted points in this category is 67.
Now let’s look at the student’s results for each test.
| Item name | Student score | Possible points | Item weight |
|---|---|---|---|
| Test 1 | 22 points | 30 points | 15% |
| Test 2 | 25 points | 30 points | 15% |
| Test 3 | 40 points | 60 points | 15% |
| Test 4 | 55 points | 60 points | 15% |
| Final Exam | 80 points | 100 points | 40% |
| 222 points | 280 points | 100% |
We know the achievable points for the column, so let’s see what weighted scores the student achieved.
- Test 1: 22/30 points x .15 = .11
- Test 2: 25/30 points x .15 = .125
- Test 3: 40/60 points x .15 = .1
- Test 4: 55/60 points x .15 = .1375
- Final exam: 80/100 points x .4 = .32
The sum of these achieved weighted percentages is .7925, or roughly 79%.
To find out the weighted score total for this column, we multiply the achieved weighted percentage and the possible weighted points.
.7925 x 67 points = 53.0975 points
Create weighted columns
The basics for creating a calculated column are listed in the total column section. This table lists the options that appear after you move a category to the Selected Columns box.
| Option | Description |
|---|---|
| Grading Period menu | If you selected a category for the calculation, you can limit the columns used by selecting a particular grading period. |
| Weight Columns | Select how to weigh columns within the category.
|
| Drop Grades | Removes a number of either the highest or lowest grades for each category from the calculation. If you don't type numbers in the boxes, no grades are dropped. |
| Use only the Lowest -OR- Highest Value to Calculate | Removes all grades from the calculation except for the best or worst score. |
Type a percentage for each selection. The percentages of all columns added together must equal 100% to distribute the percentages as you expect.
You're allowed to save if the percentage is less than 100. By design, if the weights don't equal 100%, the weighting is distributed equally among the columns to achieve the 100%. If you feel the weighted calculations are incorrect, check the weights on the Edit Weighted Column page and adjust the percentages as needed.
After you assign the last percentage, click anywhere in the box to update the percentage located below the Selected Columns box in the Total Weight field.
To delete a selection in the Selected Columns box, select the red X.
If you delete a column that is included in the calculation for a weighted column, the percentage assigned to the deleted column is removed. In the Selected Columns box, the Total Weight will no longer equal 100%. The calculation does balance itself, but it won't necessarily be based on the percentages you assigned because a column is missing. The system doesn't update percentages in the Selected Columns box, but the grade that appears in the weighted column in the Grade Center is based on 100%.
Equal and proportional weighting
When the columns and categories you select for the weighted column have different point values, Equal weighting converts them to percentages. These percentages are averaged to obtain an equal value for each of the items included in the weighted column. Equal weighting gives each item equal weight when determining the composite grade.
Proportional weighting adds the raw scores of the included columns and categories. Then, the system divides the result by the total points possible to obtain a percentage for each item in the weighted column. The resulting percentages retain the proportional weight of each item so that items with a larger point value have more effect on the composite grade.
Running totals for weighted columns
You can select Calculate as Running Total for a weighted column. Columns and categories without grades aren't included in the weighted column's total that displays in the Grade Center.
The Calculate as Running Total option affects the score displayed for the weighted column in the Grade Center. In this example, Category C has no scores. The example uses categories, but the same principles apply if you select columns instead of categories.
| Category A Weight 40% |
Category B Weight 40% |
Category C Weight 20% |
|
|---|---|---|---|
| Points Achieved | 90 | 75 | - |
| Points Possible | 100 | 100 | 100 |
| Weighted Value | 90 pts * 40% = 36 | 75 pts * 40% = 30 | - |
Example: Calculated as Running Total = 82.5%
When calculated as a running total, the weighted column's total percentage is calculated by taking the sum of the weighted values of category A and B and multiplying by 100/80. The denominator of 80 is the summed weights of only the categories that contain scores (40 + 40 = 80).
(36 + 30) * 100/80 = 82.5%
Example: NOT Calculated as Running Total = 66%
When not calculated as a running total, the weighted column's total percentage is calculated by summing the weighted values for categories A, B, and C and multiplying by 100/100. The denominator of 100 is the summed weights of all categories—which is always 100.
(36 + 30 + 0) * 100/100 = 66%
Want to include extra credit in your weighted total? Visit the extra credit topic.
About average columns
The average column displays the average for a selected number of columns. For example, you can display the average for all tests or display the average grade for each student for a grading period.
Simple average formula
To find the average of all selected columns, the percentage is calculated to four decimal places. The percentage values for all selected columns are added together. The result is divided by the number of columns included in the calculation. The result displays according to the Primary and Secondary Display options.
(Column 1%) + (Column 2%) + (Column 3%) + (Column 4%) = % earned divided by 4 columns = Average percentage score
Example:
Three values: 8/10, 3/5, 2/2
Percentage equivalents: 80.0000%, 60.0000%, 100.0000%
Total of the values: 240.0000
Number of items: 3
Total value divided by number of columns: 240.0000/3 = 80.00%
Create average columns
The basics for creating a calculated column are listed in the total column section. For Weight Columns, select how to weigh columns within the category:
- Select Equally to apply equal values to all columns within a category.
- Select Proportionally to apply the appropriate value to a column based on its points compared to other columns in the category.
About minimum/maximum columns
The minimum/maximum column displays either the minimum or maximum grade for a selection of columns. For example, you can find the minimum score on all tests. You can choose whether or not to show the column to students on their My Grades pages.
Minimum/maximum formula
The percentage value for each column included in the calculation is compared up to four decimal places and the lowest or highest value is displayed. The result displays up to two decimal places.
Example:
Three values: 8/10, 3/5, 2/2
Percentage equivalents: 80.0000%, 60.0000%, 100.0000%
Minimum: 60.00%
Maximum: 100.00%
If two values are exactly the same for a minimum/maximum column, that is the value that appears in the Grade Center grid.
Create minimum/maximum columns
The basics for creating a calculated column are listed in the total column section. In the Select Columns section, select Calculation Type: Minimum or Maximum.