This information applies only to the Ultra Course View.
Question analysis provides statistics on overall performance, assessment quality, and individual questions. This data helps you recognize questions that might be poor discriminators of student performance. Question analysis is for assessments with questions. You can run a report before all submissions are in if you want to check the quality of your questions and make changes.
Uses for question analysis:
- Improve questions for future assessments or to adjust credit on current attempts
- Discuss assessment results with your class
- Provide a basis for remedial work
- Improve classroom instruction
Example:
After the question analysis, you notice that the majority of students answer one question incorrectly. Why the low success rate?
- Is the wording of the question confusing?
- Are the answer options unclear?
- Were students given the right content to learn to successfully answer this question?
- Was the content to learn easily accessible and clear?
Based on what you discover, you can improve the question to truly assess what students know or don't know.
Access an assessment's analysis
You can run and access a previous question analysis report from these course areas:
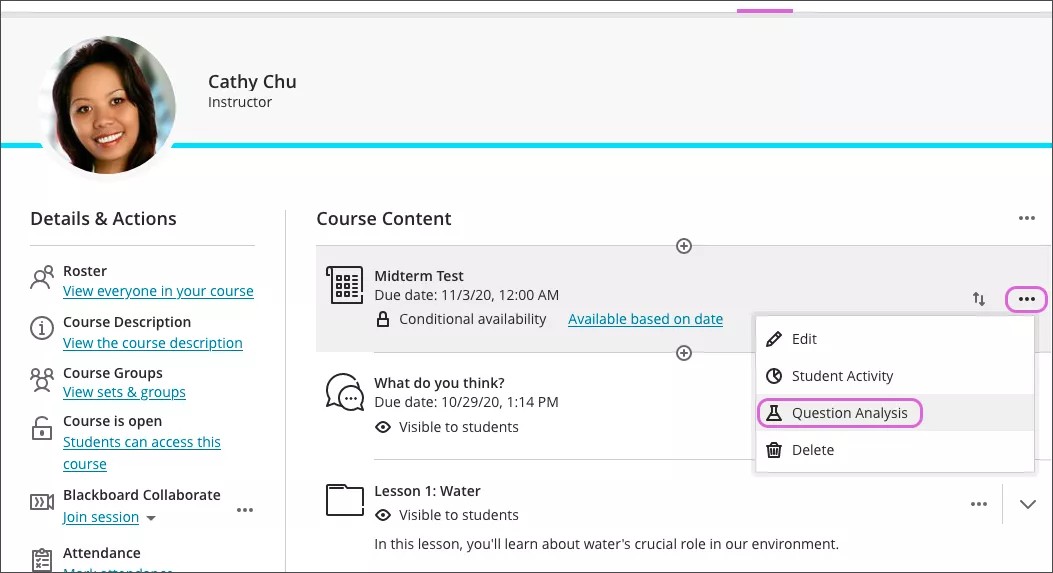
- Course Content page > assessment's menu
- Course Analytics page > Question Analysis tab—if your institution has enabled analytics
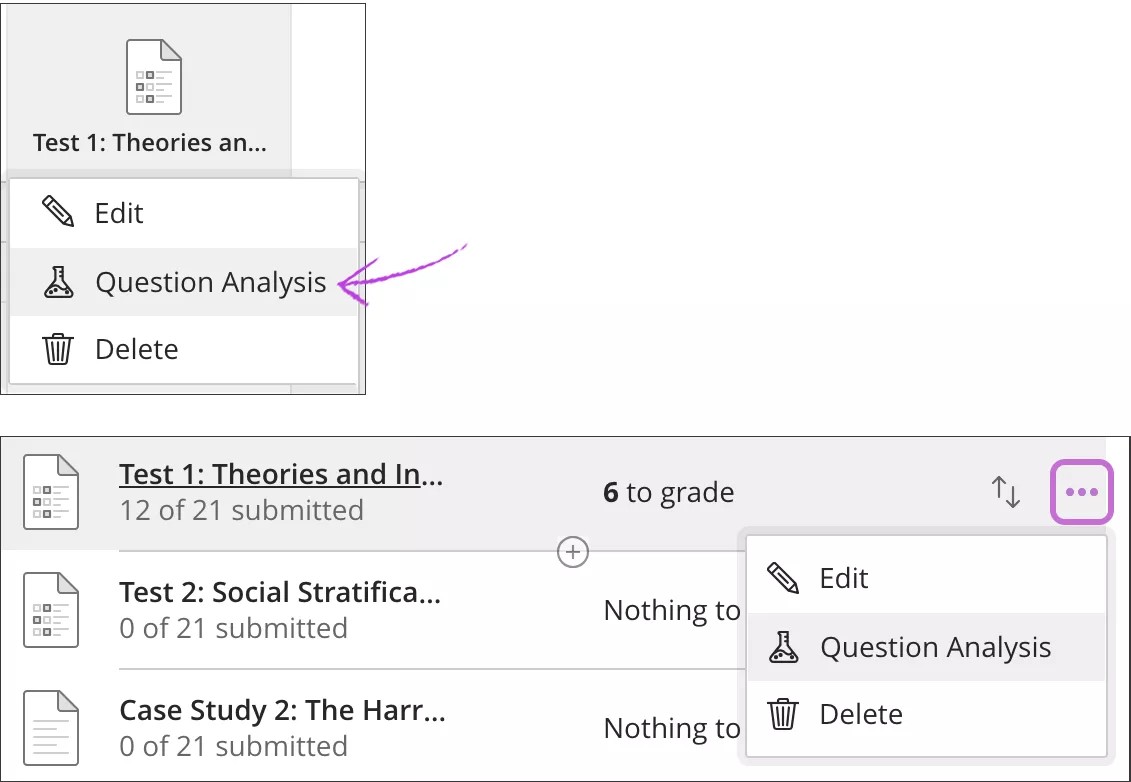
- Gradebook
On the Course Content page, access an assessment's menu and select Question Analysis. You can also select the Analytics icon on the navigation bar.
You can also run a question analysis report from the gradebook. Access an assessment's menu and select Question Analysis.
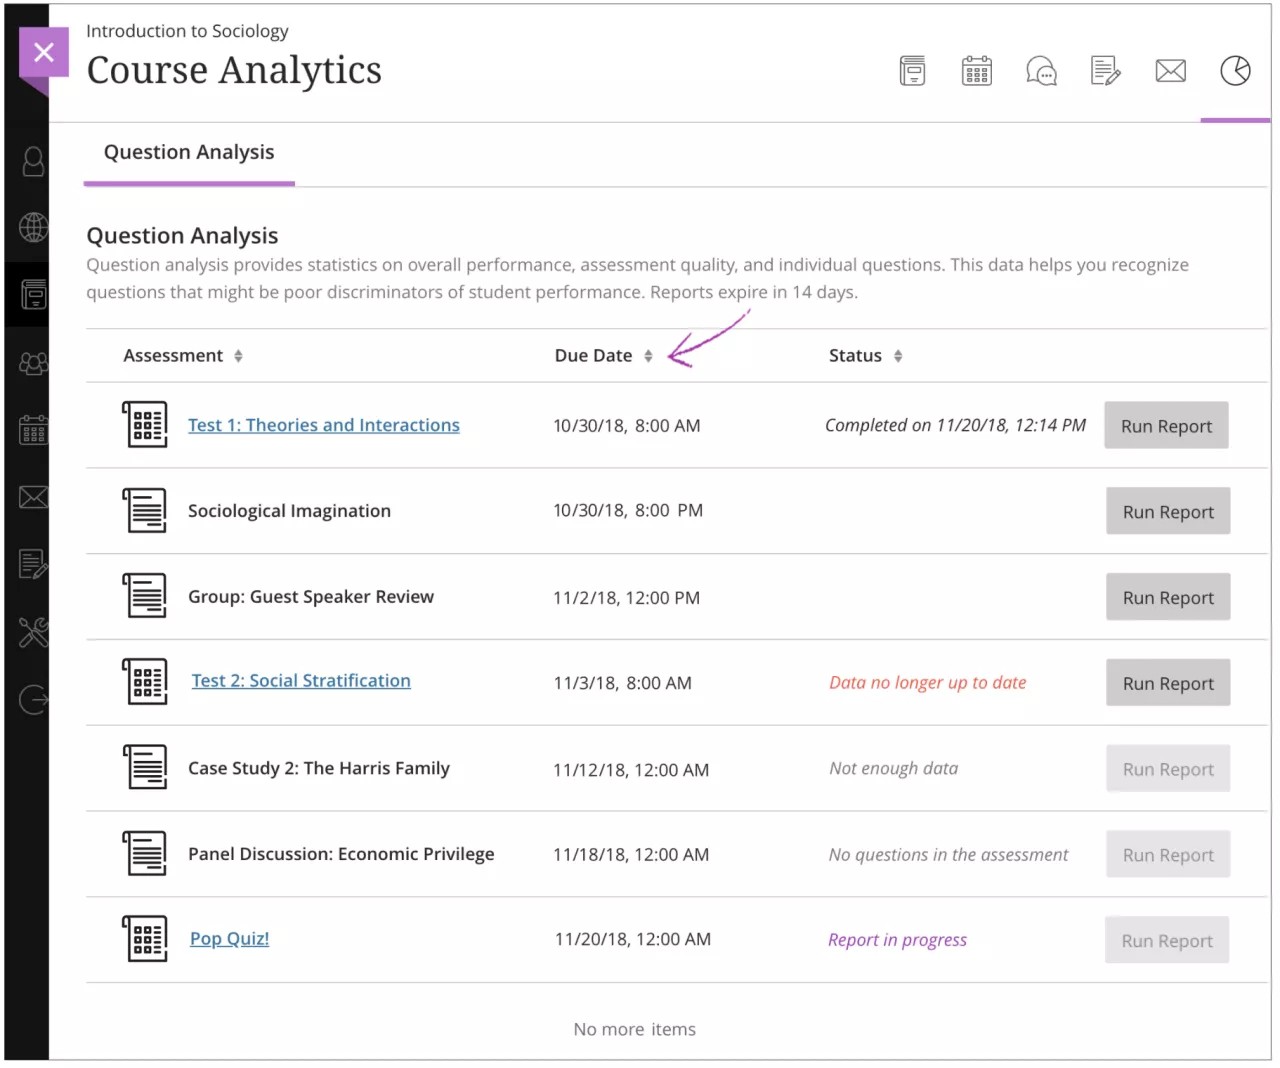
Question Analysis page
The Question Analysis page is only accessible from the navigation bar > Analytics > Course Analytics page > Question Analysis tab.
You can run a report on an assessment with submissions and no questions, but you'll receive a report with no usable information.
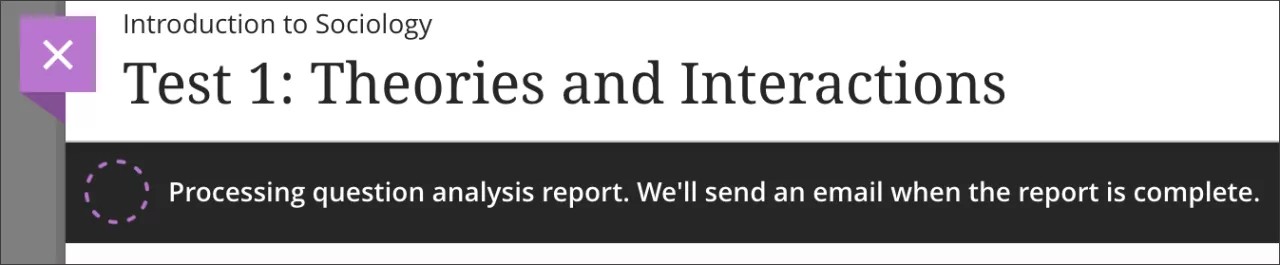
You'll receive a message that the question analysis report is in process and an email when the report is complete. You can leave the page to work in other areas of your course and return later to see if the report is ready.
Status column
Each assessment in your course appears with one of these statuses:
- Report in progress
- Completed on {date}
- Data no longer up to date: Assessment now has more submissions to analyze.
- Not enough data: No submissions exist. Run Report is disabled.
- No questions in the assessment: Assessment has no questions or submissions. Run Report is disabled.
- No status listed: Assessment has questions and submissions, but you've run no report. Run Report is enabled.
- Error: Run
View the question analysis assessment summary
After you run a report, you can view overall summary information and details about each question. Select the assessment on the Question Analysis page to view the summary.
Only submitted attempts are used in calculations. When attempts are in progress, those attempts are ignored until they're submitted and you run the analysis report again. Automatic zeros assigned for late work aren't included in calculations.
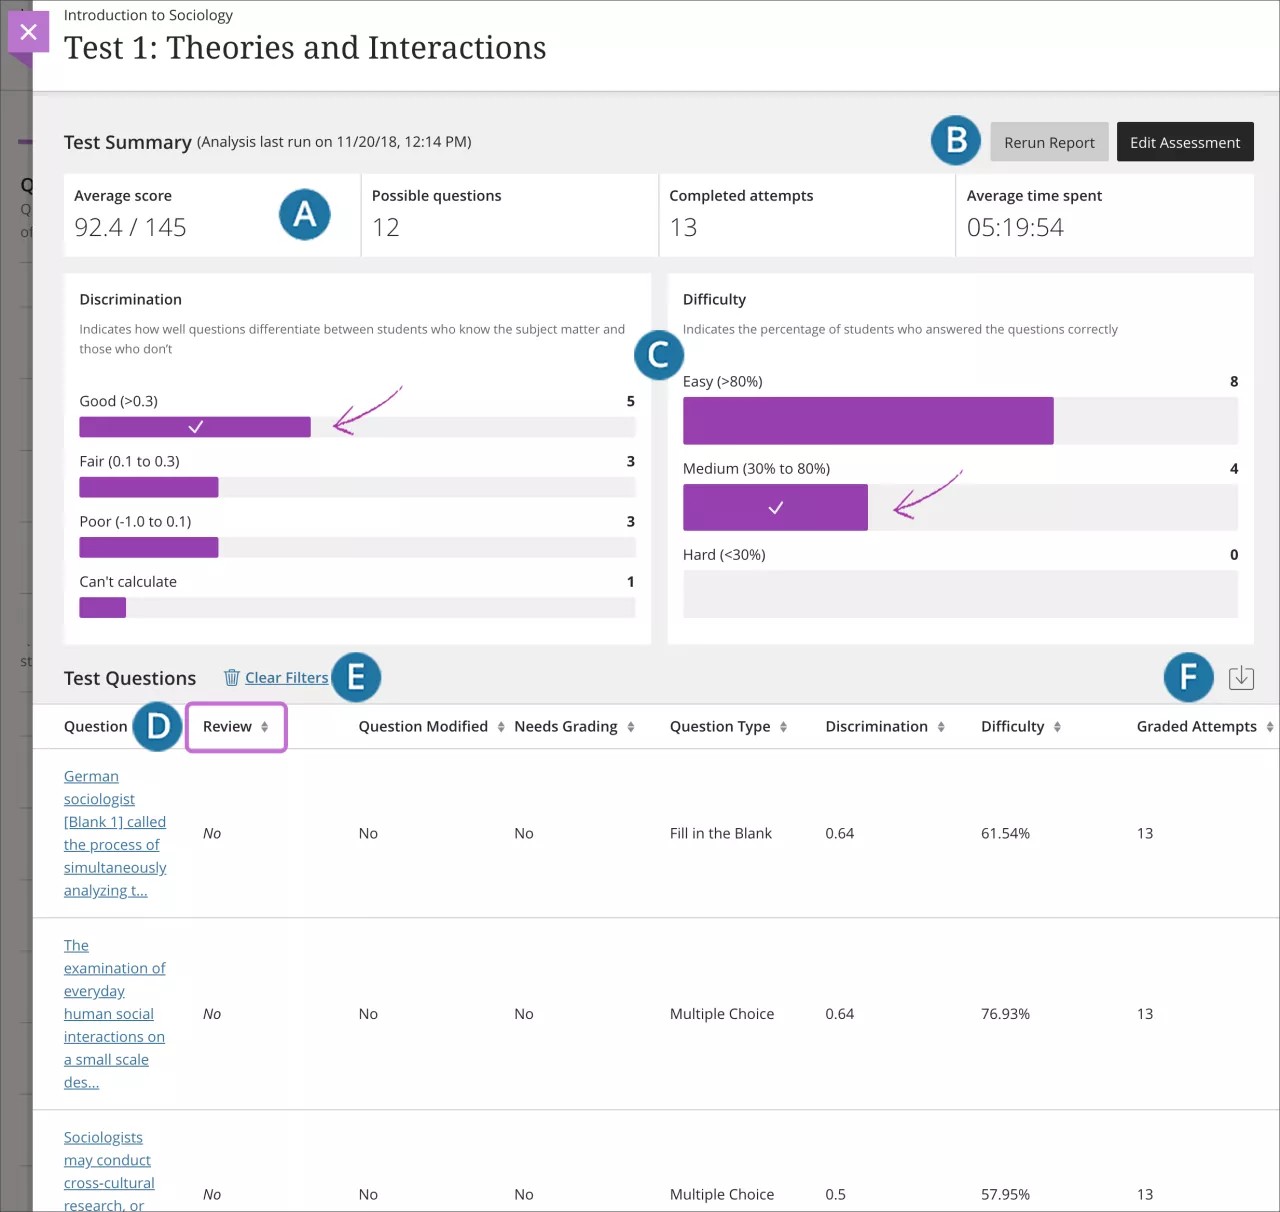
- Summary of statistics for the individual assessment:
- Average score: The score shown is the average score reported for the assessment in the gradebook. The average score can change if more attempts are submitted and graded.
- Possible questions: The total number of questions in the assessment.
- Completed attempts: The number of submitted assessments.
- Average time spent: The average completion time for all submitted attempts.
- Rerun a report or edit the assessment to make a change to questions.
- Use the graphs to filter the table of questions. Make selections in both graphs to refine your search. If you make no selections, all the questions appear in the table at the bottom of the page.
- Discrimination: Indicates how well questions differentiate between students who know the subject matter and those who don’t.
- Shows the number of questions that fall into these categories:
- Good (greater than 0.3)
- Fair (between 0.1 and 0.3)
- Poor (less than 0.1) categories
- Can't calculate: A question's difficulty is 100% or all students received the same score on a question.
- Questions with discrimination values in the Good and Fair categories differentiate between students with higher and lower levels of knowledge.
- Questions in the Poor category are recommended for review.
- Shows the number of questions that fall into these categories:
- Difficulty: Percentage of students who answered the questions correctly
- Shows the number of questions that fall into these categories:
- Easy (greater than 80%)
- Medium (between 30% and 80%)
- Hard (less than 30%)
- Questions in the Easy or Hard categories are recommended for review.
- Shows the number of questions that fall into these categories:
- Discrimination: Indicates how well questions differentiate between students who know the subject matter and those who don’t.
- Select a heading to sort the questions. For example, sort the Review column so questions that need review appear first.
- Clear Filters: Clear the filters you selected in the graphs and display all questions in the table.
- Download the question analysis report
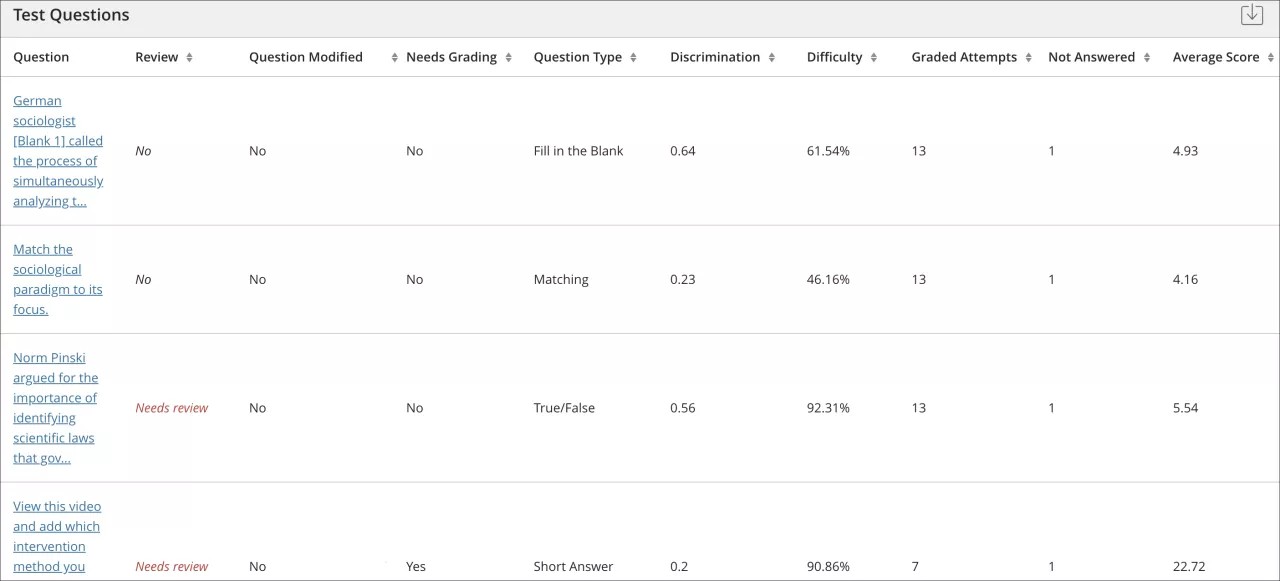
About the questions section in the assessment summary
The questions table provides analysis statistics for each question in the assessment. After you use the graphs to filter the questions table, you can view and sort the results.
In general, good questions fall in these categories:
- Medium (30% to 80%) difficulty
- Good or Fair (greater than 0.1) discrimination values
In general, questions recommended for review fall in these categories. They may be of low quality or scored incorrectly.
- Easy ( > 80%) or Hard ( < 30%) difficulty
- Poor ( < 0.1) discrimination values
Reminder: If you make no selections, all the questions appear in the table at the bottom of the page.
To investigate a specific question, select the title and review the question details.
Information for each question appears in the table:
- Needs review: Triggered when discrimination values are less than 0.1. Also, when difficulty values are either greater than 80% (the question was too easy) or less than 30% (the question was too hard). Review the question to determine if it needs revision.
Question Modified: Displays Yes if you run a report, then change part of a question, and rerun the report. Yes also appears if you copied the question from another assessment when you created the assessment.
If Yes appears in the Question Modified column for a question, the Yes doesn't carry over when you archive and restore the course.
Discrimination: Indicates how well a question differentiates between students who know the subject matter and those who don't. A question is a good discriminator when students who answer the question correctly also do well on the assessment. Values can range from -1.0 to +1.0. A question is flagged for review if its discrimination value is less than 0.1 or negative. Discrimination values can't be calculated when the question's difficulty score is 100% or when all students receive the same score on a question.
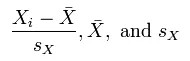
Discrimination values are calculated with the Pearson correlation coefficient. X represents the scores of each student on a question and Y represents the scores of each student on the assessment.
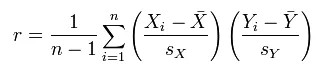
- These variables are the standard score, sample mean, and sample standard deviation, respectively:
Difficulty: The percentage of students who answered the question correctly. The difficulty percentage is listed along with its category: Easy (greater than 80%), Medium (30% to 80%), and Hard (less than 30%). Difficulty values can range from 0% to 100%. A high percentage indicates the question was easy. Questions in the easy or hard categories are flagged for review.
Difficulty levels that are slightly higher than midway between chance and perfect scores do a better job differentiating students who know the tested material from those who don't. High difficulty values don't assure high levels of discrimination.
- Graded Attempts: Number of question attempts where grading is complete. Higher numbers of graded attempt produce more reliable calculated statistics.
- Average Score: The score that appears is the average score reported for the assessment in the gradebook. The average score might change after all attempts are graded.
View details for a single question
You can investigate questions flagged for your review and view student performance. From the Question Analysis questions table, select a linked question title to access the question's summary.
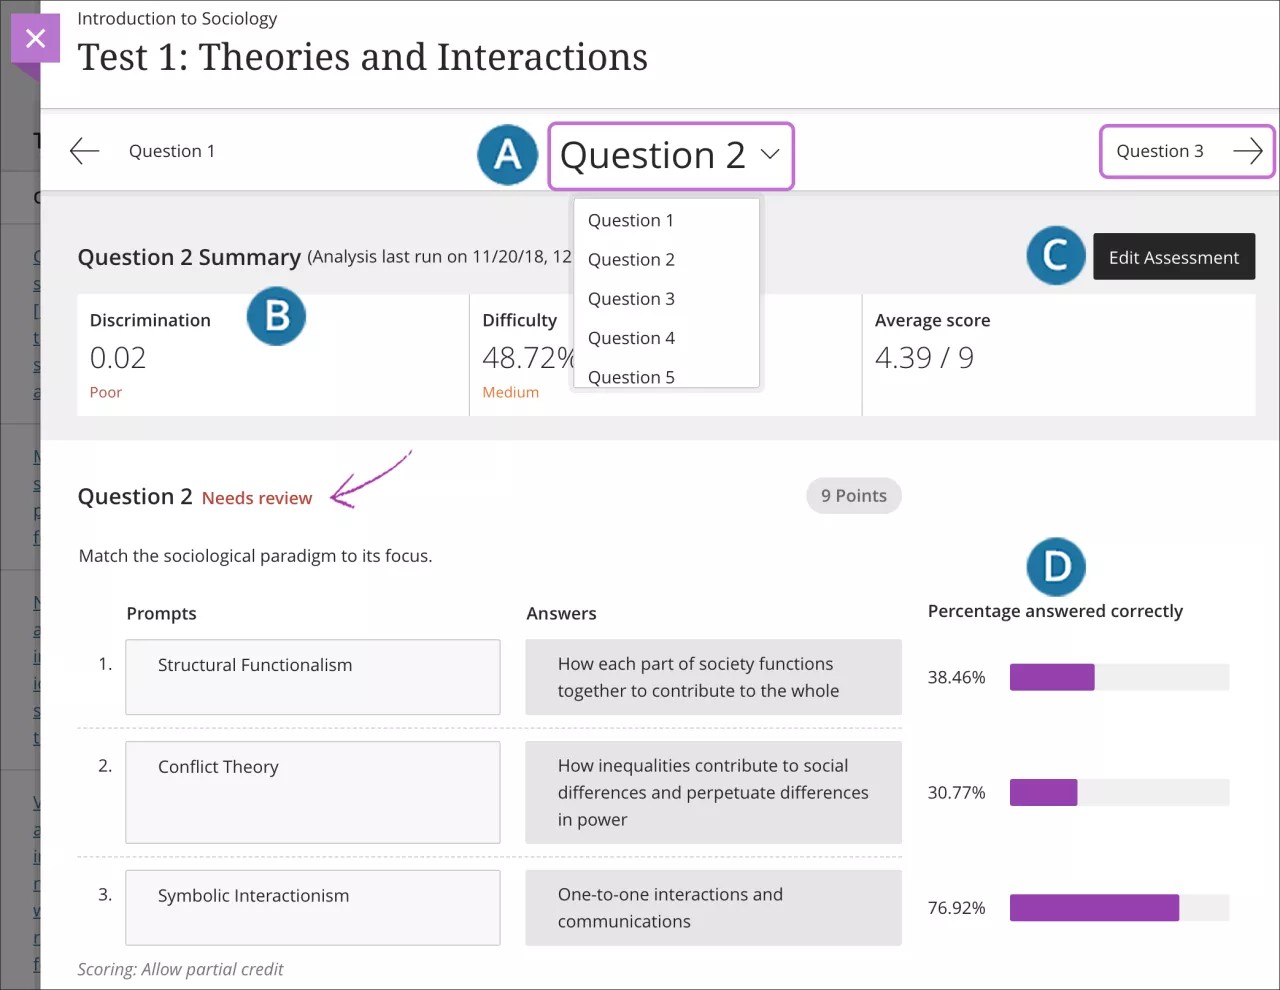
- After you access a question, use the question title's menu to access any question in the assessment. You can navigate to other questions sequentially on either side of the page.
- The summary table displays statistics for the question.
- Select Edit Assessment to access the assessment and make changes.
- The question text and answer choices appear. You can see how many students chose each answer choice or the percentage answered correctly. For example, for a Matching question, you see what percentage of students matched the pairs correctly. Only the question text appears for Essay questions.
About multiple attempts, question overrides, and question edits
The analysis handles some common scenarios in these ways:
- When students take an assessment multiple times, the last submitted attempt is used as the input for the analysis. As soon as a student submits another attempt, subsequent analyses will include that newest attempt.
- Gradebook overrides don't impact the analysis data because the analysis generates statistical data for questions based on completed student attempts.
- When you make changes to a question or manually grade questions, you must run the analysis again to see if the changes affect the data.
Examples
Question analysis can help you improve questions for future assessment administrations. You can also fix misleading or ambiguous questions in a current assessment.
- In a Multiple Choice question, an equal number of students chose A, B, and C. Examine the answer choices to determine if they're ambiguous, if the question is too difficult, or if the material wasn't covered.
- A question is recommended for review because it falls into the hard difficulty category. You determine the question is hard, but you keep it to adequately evaluate your course objectives.
- A Multiple Choice question is flagged for your review. More Top 25% students chose answer B, but A is the correct answer. You realize you didn't choose the correct answer when you created the question. You edit the assessment question and it's automatically regraded.
Download assessment results
You may need to download test results for external analysis and evaluation. External analysis is important for supporting course quality and assessment efforts. Besides, institutions often want compiled assessment data for accreditation and program review activities.
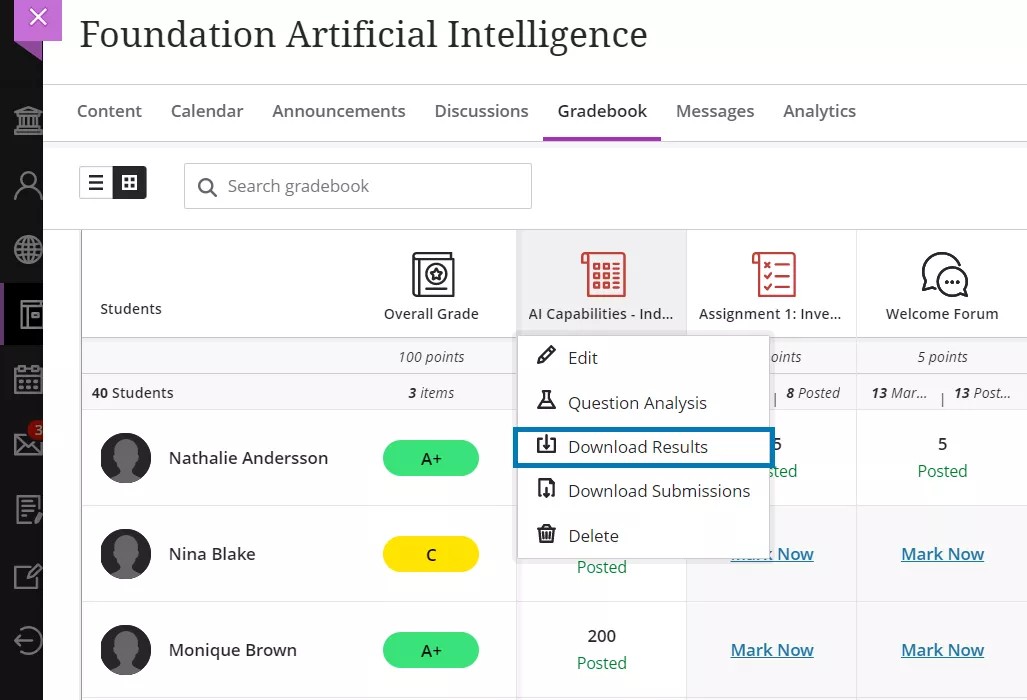
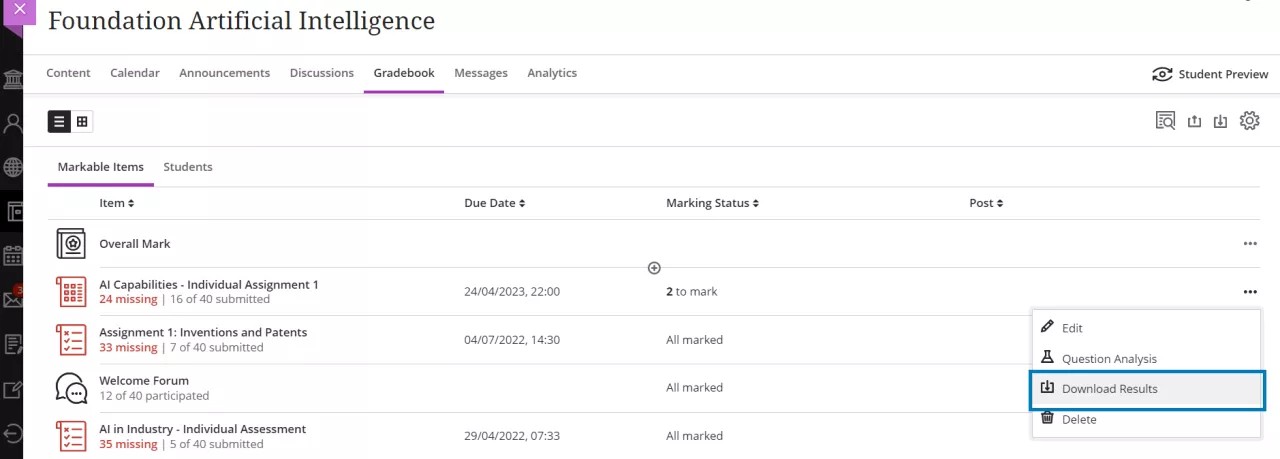
You can download assessment results from the gradebook:
- From the Grades view, select the assessment to display the options menu and choose Download results.
- From the Gradable items view, select the options menu of the assessment and choose and choose Download results.
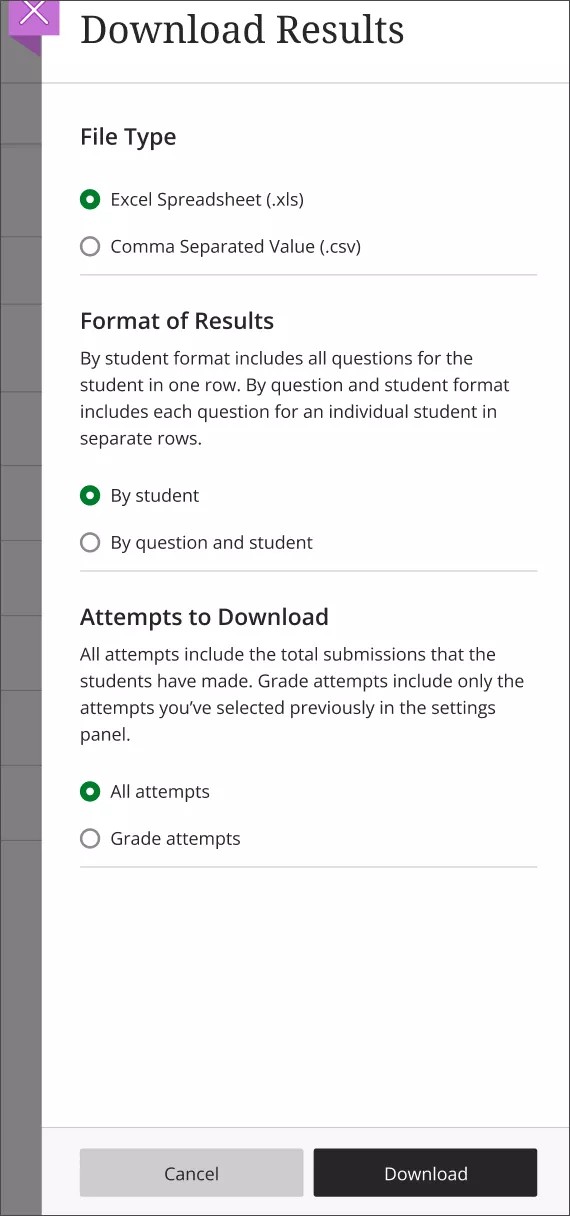
You'll find several options when downloading results.
- File type: Excel spreadsheet (.xls) or Comma Separated Value (.csv). The default is .xls.
- Format of results: By student or by question and student. The default is by student.
- Attempts to download: Either all attempts or only attempts included in the grade calculation. You can define which attempts to include in the grade calculation in the Grade attempts settings. The default is to download only attempts used for calculation.
The downloaded report includes the following information:
- Student name
- Username
- Questions
- Answers
- Grading status
- Any content the student may have included with their submission
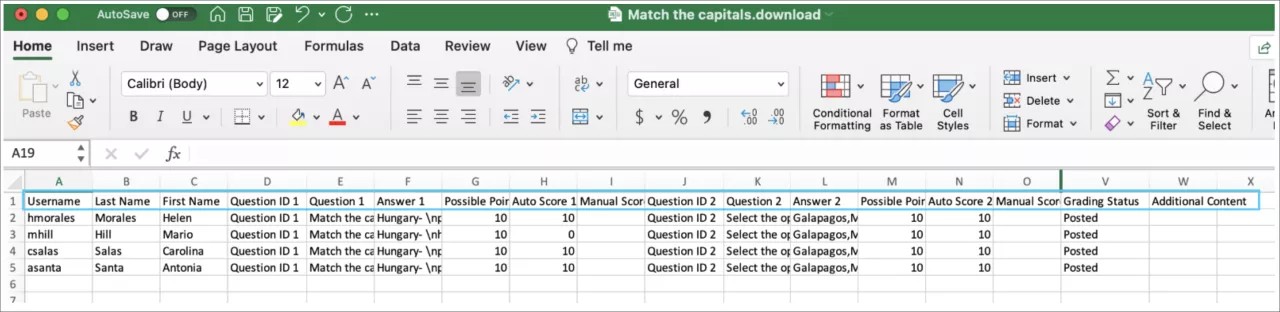
Sample for the result format Download by student:
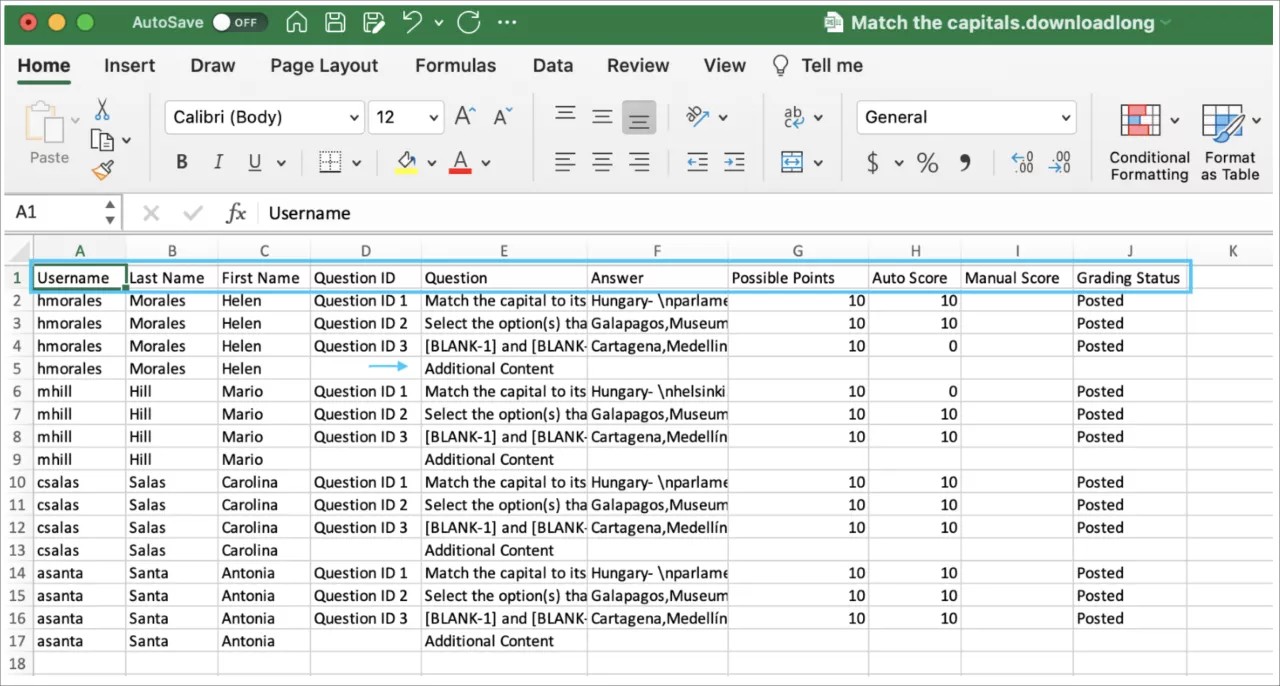
Sample for the result format Download by student and question:
If you use anonymous grading, the downloaded results exclude student and score details until the grades are posted for all students.
Watch a video about how to download assessment results
The following narrated video provides a visual and auditory representation of some of the information included on this page. For a detailed description of what is portrayed in the video, open the video on YouTube, navigate to More actions, and select Open transcript.
Video: Download assessment results shows how to download test and assessment results data.