For the latest updates and releases for Anthology Illuminate Reporting visit and follow Anthology Illuminate – Release Notes page.
Archived release notes
Keep track of what we've released in the past.
Snowflake Account Settings
Continuous Delivery | Release to Production 22 September 2021
New features
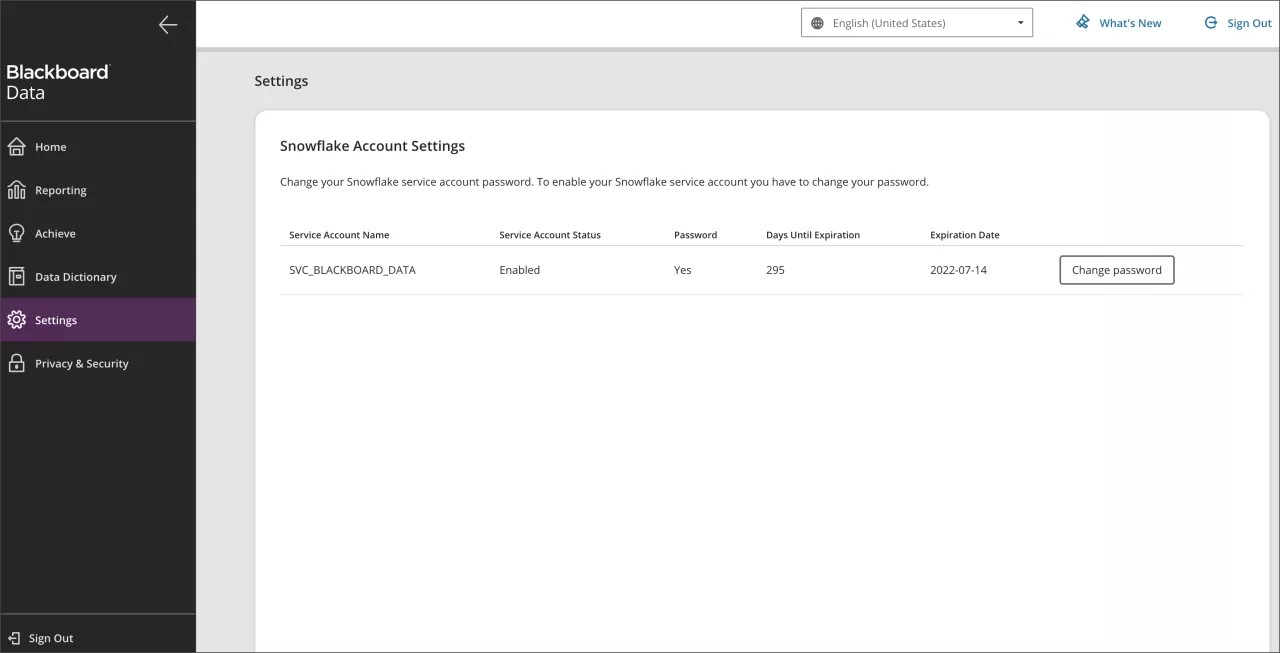
We’re excited to announce that Blackboard Data now has a Snowflake Account Settings panel from which you can manage your service account. Blackboard Data service accounts allow you to perform Machine to Machine connections to your Snowflake Reader Account via the supported Snowflake Connectors & Drivers. Institutions that use Blackboard Data automatically get a service account provisioned. You can now access it through Blackboard Data's (data.blackboard.com) new Settings menu.
To access this page, you'll need a Blackboard Data Account (Auth0) or have your institutional account setup (BbSSO).
Service accounts have a fixed password expiration date of 60 days. On the Settings page, you can check the status of the account password as well as a link to change your password.
Each institution will get one (1) service account with the following characteristics:
-
Limited to an XS Warehouse with a credit limit of 350 Snowflake credits(!) per month.
A Snowflake Credit is approximately 1 hour of usage of Snowflake.
-
Limited to the supported Snowflake Connectors & Drivers.
Blackboard Achieve and Reporting Tier
Continuous Delivery | Release to Production 09 Sep 2021
New features, Blackboard Achieve, Reporting
New Language Selector
We’re excited to announce that Blackboard Data now has a language selector. You can select your preferred language from the available language pack. This pack has 14 languages. Blackboard Data initially appears in the default language, English (United States), until you select another language. The platform then reloads in your selected language.
Note: There are terms that aren’t currently localized and will remain in English after you’ve selected another language. The localized version of these terms will be delivered in a progressive manner throughout 2021 and 2022.
Blackboard Achieve – New Detailed Data filtered by Institutional Hierarchy Node, Course, and/or Student.
Continuous Delivery | Release to Production 29 June 2021
New features, Blackboard Achieve
This feature is only available to clients with the Blackboard Achieve license.
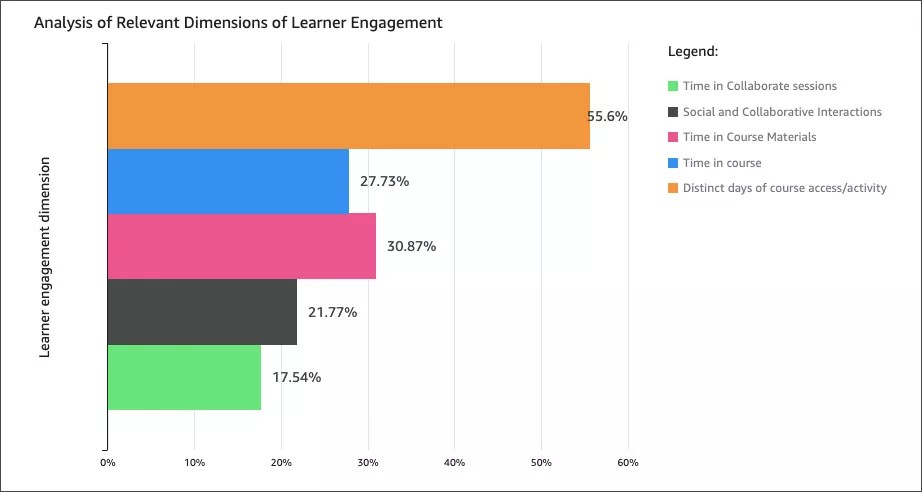
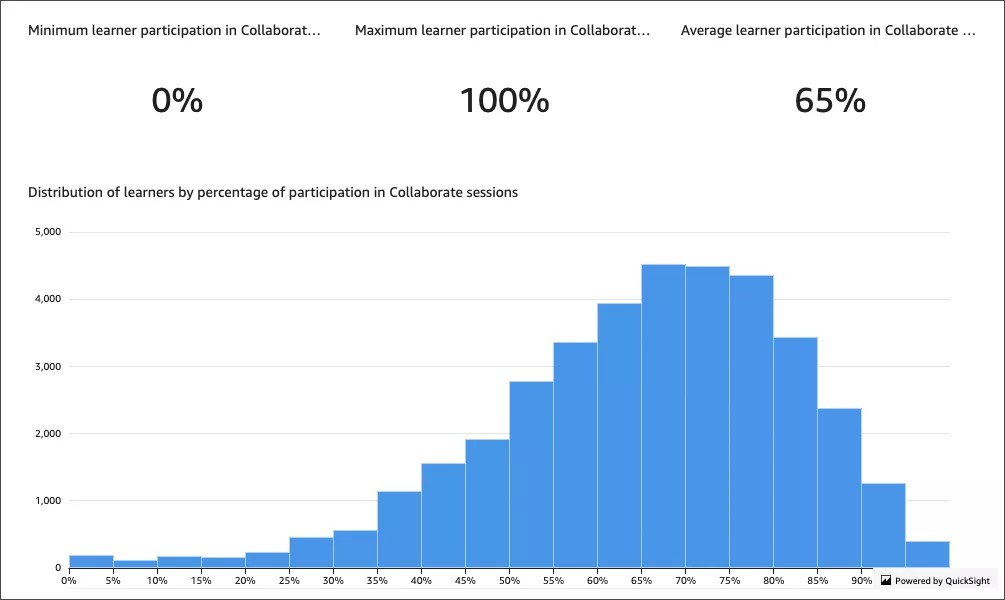
We are excited to announce the addition of detail-level data, with the grains of institutional hierarchy node, course, and/or student, in all reports and report tabs. We have added new tables with disaggregated data and relevant measures to support your operational needs. These tables provide actionable insights that enable your decisions and interventions with individual academic units/programs, courses/instructors, and/or students.
This feature is now available to clients participating in our early adopters cohort for Blackboard Achieve. With the early input from cohort participants, we plan to continue iterating on this feature to improve the presentation and the scope of measures on instructional practices and student engagement and performance.
Blackboard Achieve
Continuous Delivery | Release to Production 01 Jun 2021
New features, Blackboard Achieve
This feature is only available to clients with the Blackboard Achieve license.
We are excited to announce the second stage of Blackboard Achieve, our solution powered by the Blackboard Data platform, to enable institutions’ academic leaders to inform strategy and policy in online learning by surfacing actionable insights into student engagement, instructor presence, and student performance at department and institution levels.
For the second release of Achieve, we picked a cohort of early adopters who have mature adoption of the Blackboard platform. These institutions will have early access to the solution and will provide feedback to inform the development of the product.
Later this year, we plan to offer Blackboard Achieve to more clients in the United States, Europe, the Middle East, and Africa; and then roll out across other regions eligible for Blackboard Data.
Blackboard Achieve will help you identify student engagement measures you should be tracking and then put these insights directly into your hands so you can know what’s working and what’s not down to the department, program, term, course, and learner.
Learning Platform Adoption Report
Continuous Delivery | Release to Production 15 February 2021
New features, Reporting
This feature is only available to participants of the Blackboard Data Insider Program. For more information about the program & eligibility, please visit Blackboard Data Insider Program.
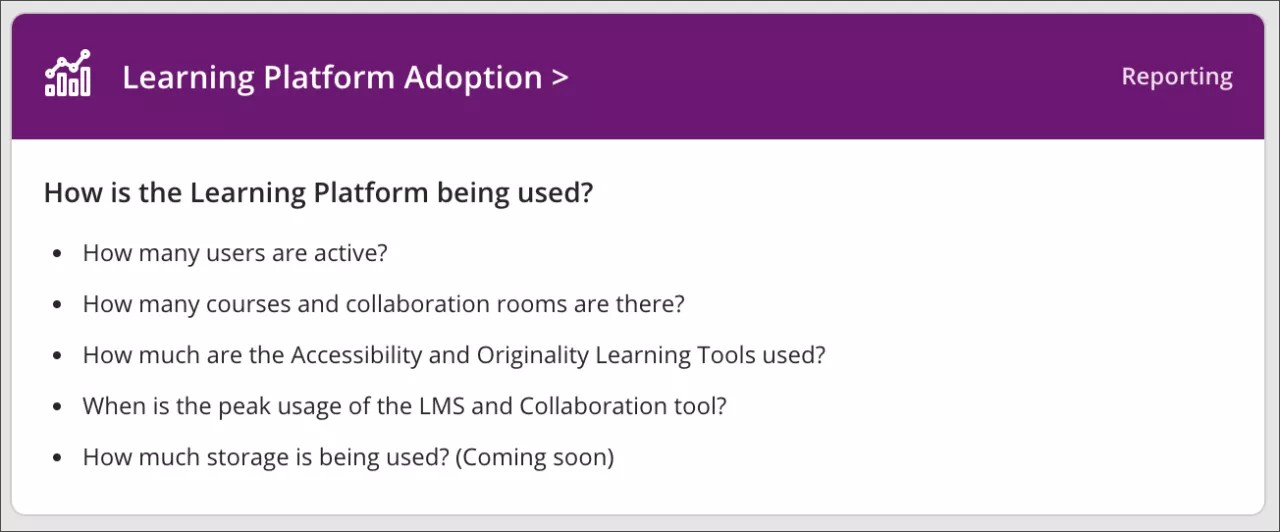
The new Learning Platform Adoption Report allows users to see, at a glance, how is the Blackboard Learning Platform being used. The initial release of this report helps users understand:
- How many users are active?
- How many courses and collaboration* rooms are there?
- How much are the Accessibility and Originality Learning Tools used?*
- When is the peak usage of the LMS and Collaboration* tool?
*Data availability depends on the products that the client licenses (Blackboard Collaborate, Blackboard Ally, and Blackboard SafeAssign)
More on the Learning Report Adoption Report
Blackboard Achieve SQL Views
Continuous Delivery | Release to Production 23 November 2020
New features, Blackboard Achieve
This feature is only available to clients with the Blackboard Achieve license.
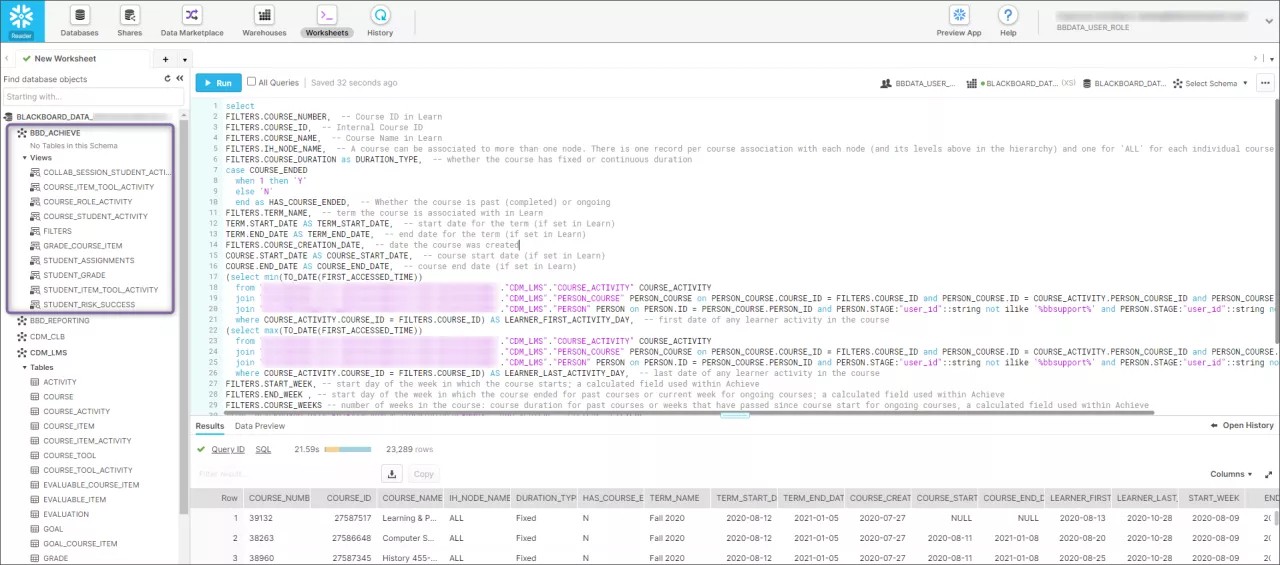
Now early adopters in the Blackboard Achieve cohort have access to the set of SQL views used in the Blackboard Achieve reports. A BBD_ACHIEVE database schema is now available to these client that includes the 10 SQL views used.
Those in the cohort will receive sample SQL scripts that use the views in the BBD_ACHIEVE schema. These scripts can be run to query disaggregated data used for Blackboard Achieve reports and visualizations.
Blackboard Achieve
Continuous Delivery | Release to Production 17 November 2020
New features, Blackboard Achieve
This feature is only available to clients with the Blackboard Achieve license.
We are excited to announce the availability of Blackboard Achieve, a new solution powered by the Blackboard Data platform, to enable institutions’ academic leaders to inform strategy and policy in online learning by surfacing actionable insights into student engagement, instructor presence and student performance at department and institution levels, and highlights the factors that align with academic performance.
Blackboard Achieve will help you identify student engagement measures you should be tracking and then put these insights directly into your hands so you can know what’s working and what’s not down to the department, program, term, course and learner.
For the first release, we picked a cohort of early adopters who have mature adoption of the Blackboard platform. These institutions will have 60-days’ access to the solution and will provide feedback to inform development of the product throughout this period. After the new year, we plan to offer Blackboard Achieve to more clients in the United States and then roll out across other regions eligible for Blackboard Data.
Secondary navigation for reporting
Continuous Delivery | Release to Production 11 November 2020
New features, Reporting
This feature is only available to participants of the Blackboard Data Insider Program. For more information about the program & eligibility, please visit Blackboard Data Insider Program.
We have improved the Navigation System of the Blackboard Dara UI by adding a new secondary navigation. This new navigation will allow users to switch between Blackboard Reporting reports with ease.
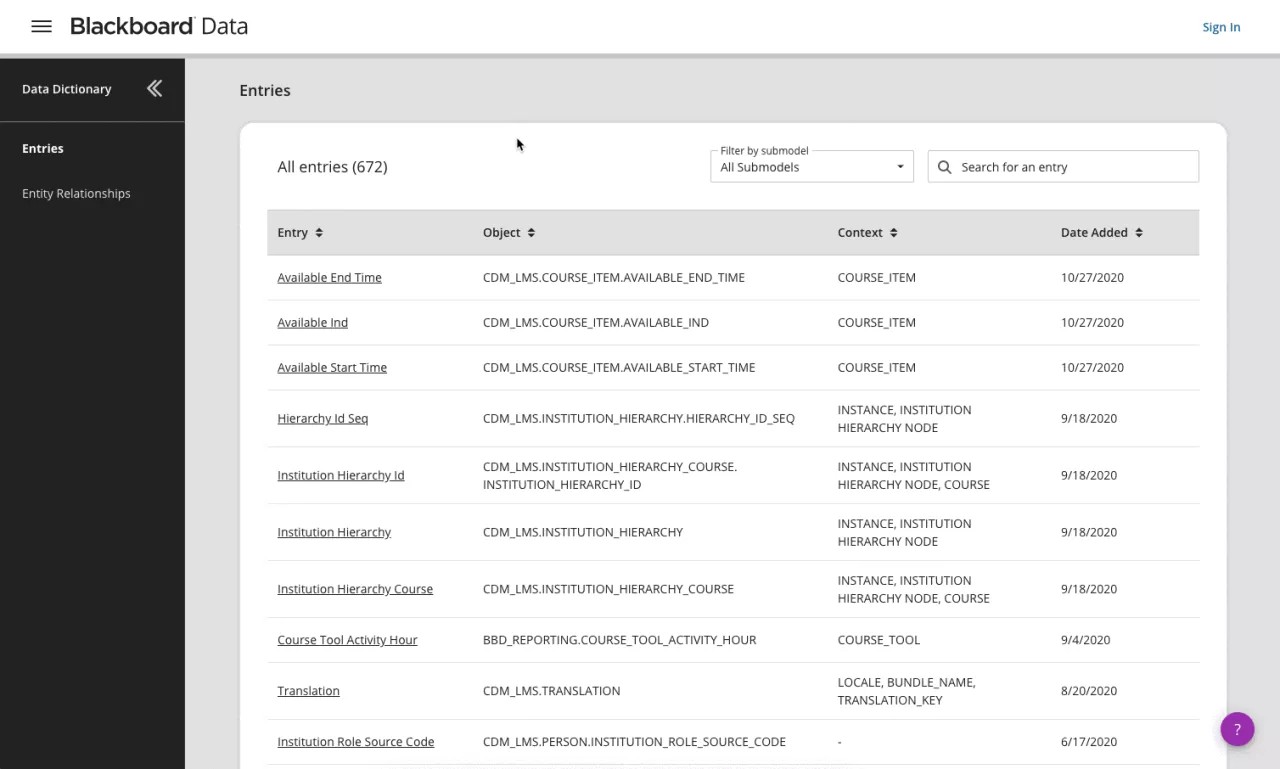
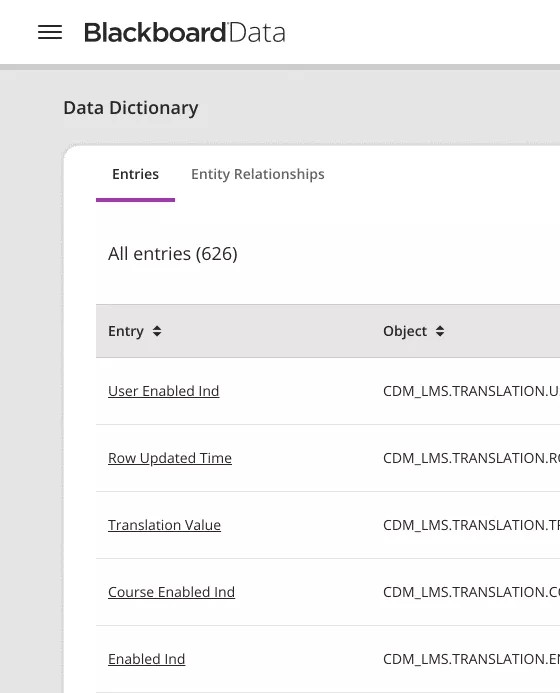
Secondary navigation for Data Dictionary
Continuous Delivery | Release to Production 11& November 2020
New features
We have improved the Navigation System of the Blackboard Dara UI by adding a new secondary navigation. This new navigation replaces the previous tab navigation on the Data Dictionary and it provides more space for the content, as it can be easily closed if it's not being used.
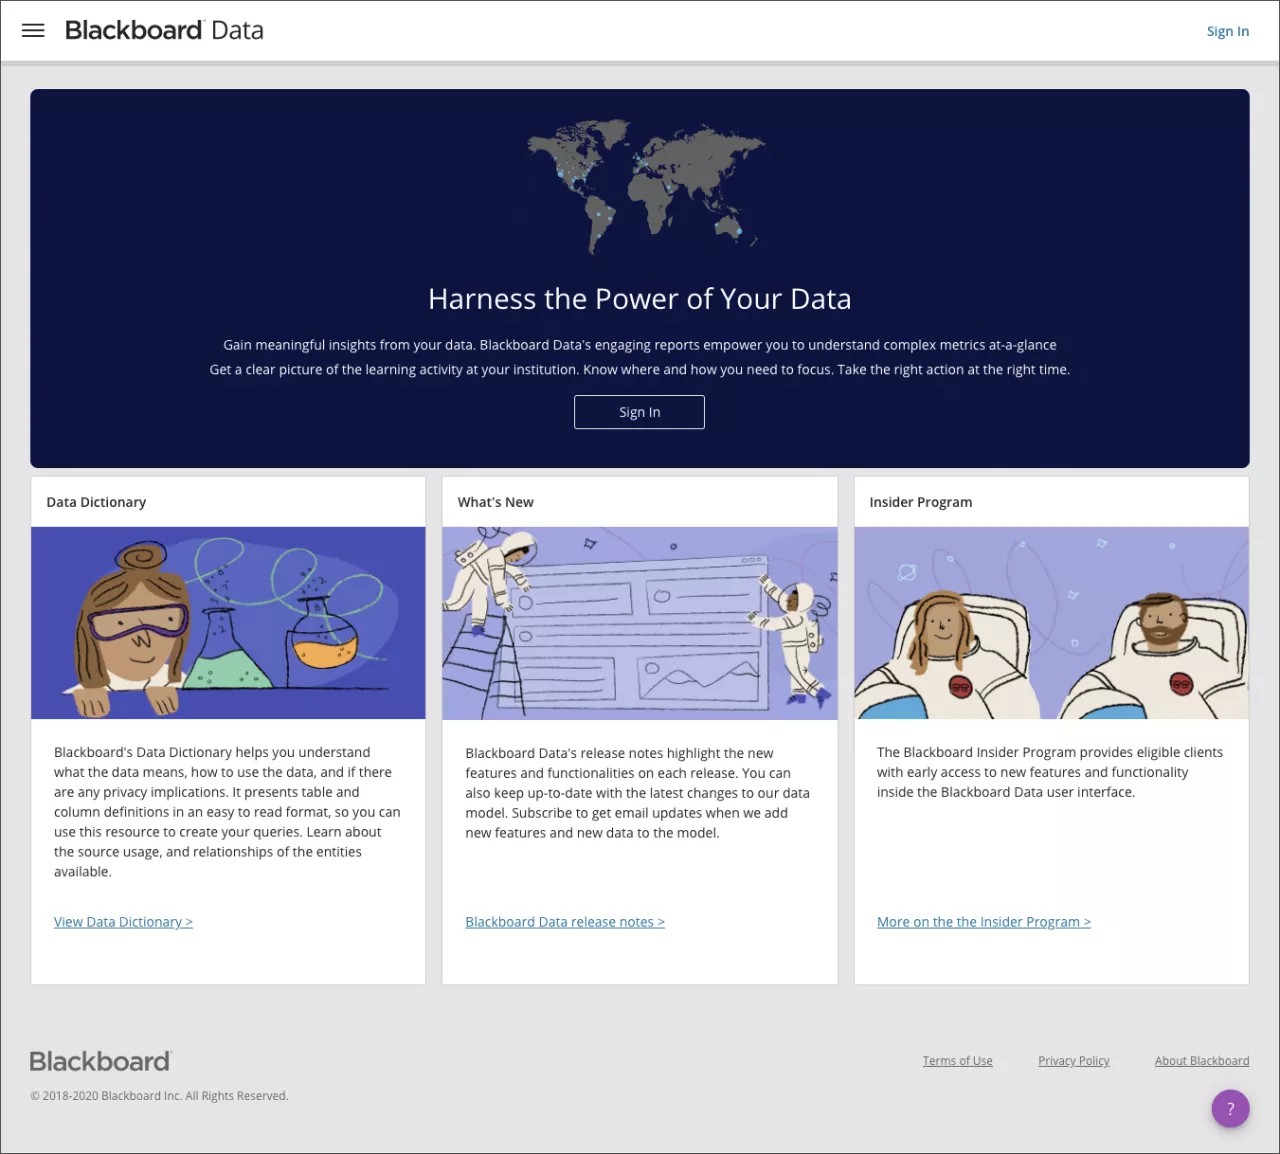
New home page
Continuous Delivery | Release to Production 11 November 2020
New features
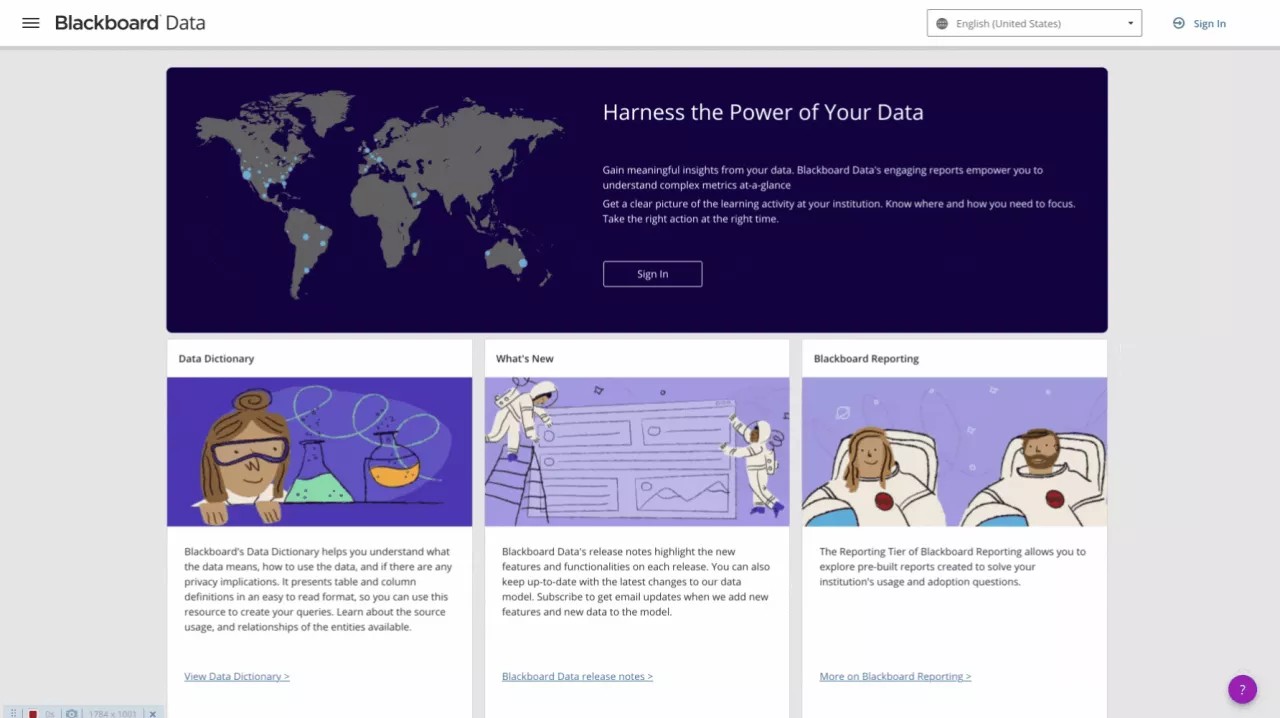
We have included a new home page for the Blackboard Data User Interface, which will be the face of our Blackboard Data products moving forward. This new page includes:
- A link to the Data Dictionary, which remains public for any user to understand what the data means, how to use the data, and if there are any privacy implications.
- A link to the Release Notes section, so our users can stay up-to-date with the latest changes to our products and data model.
- A link to an information page about the Blackboard Data Insider Program
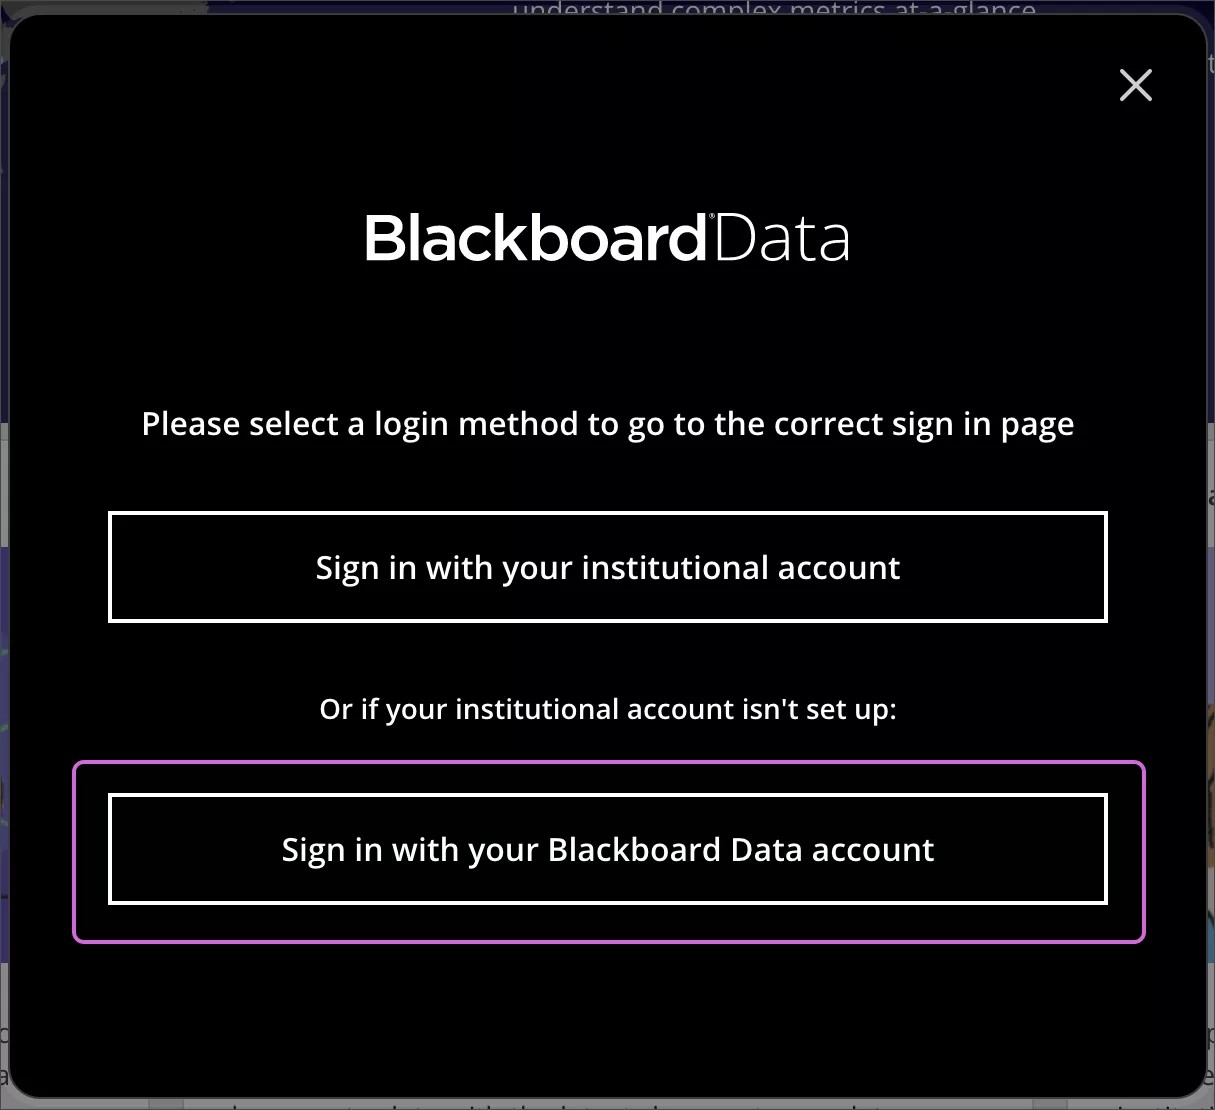
New sign in modal
Continuous Delivery | Release to Production 11& November 2020
New features
Parts of this feature are only available to participants of the Blackboard Data Insider Program. For more information about the program & eligibility, please visit Blackboard Data Insider Program.
As we move towards our new Authentication System to Support the setup of SSO for Institutional Accounts, we have added a new modal that includes two "Sign In" options:
Global Filter by Tool
Continuous Delivery | Release to Production 10 September 2020
New features, Reporting
This feature is only available to participants of the Blackboard Data Insider Program. For more information about the program & eligibility, please visit Blackboard Data Insider Program.
The Learning Tool Activity report now includes a global filter that allows users to filter the data of the report by a specific Learning Tool. Each tool name includes additional information on whether the tool is being used directly (Application) or is being used through a content handler in the content area (Content Handler).
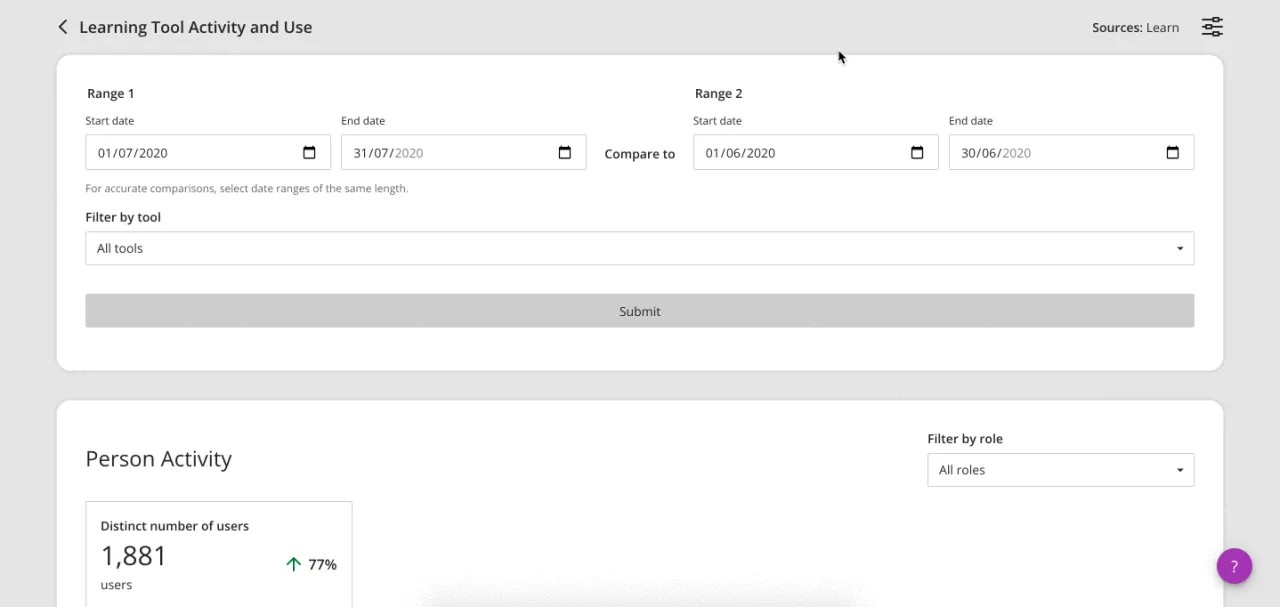
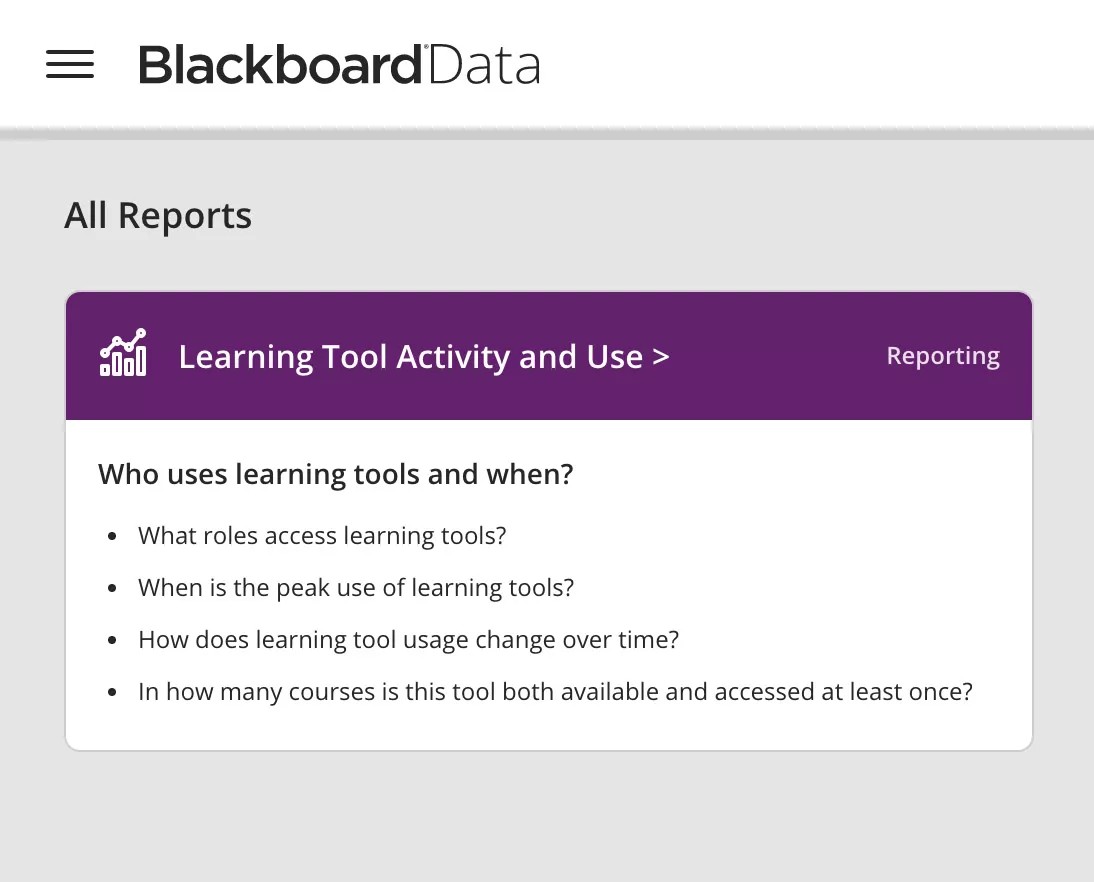
Learning Tool Activity and Use Report
Continuous Delivery | Release to Production 10 September 2020
New features, Reporting
This feature is only available to participants of the Blackboard Data Insider Program. For more information about the program & eligibility, please visit Blackboard Data Insider Program.
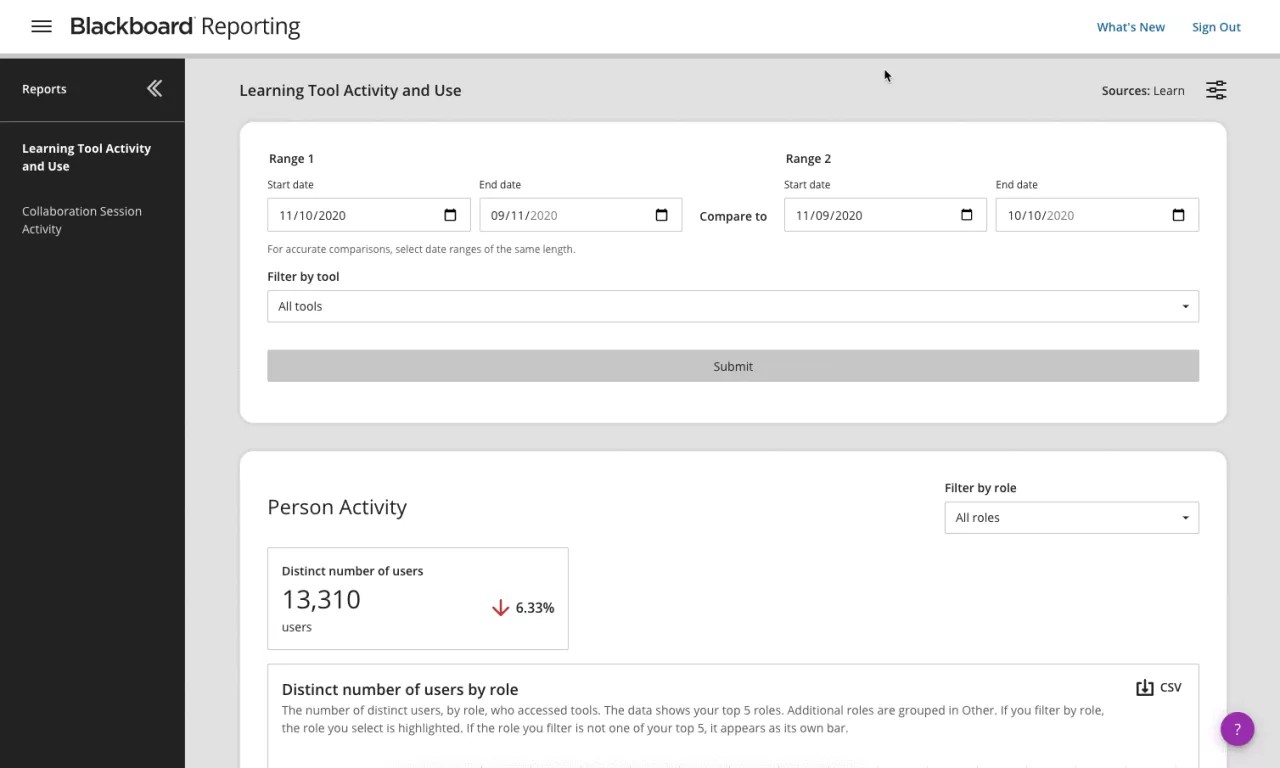
The new Learning Tool Activity and Use report allows users to see who uses the learning tools in their LMS and when they are accessing them. The initial release of this report helps users understand:
- What roles access learning tools?
- When is the peak use of learning tools?
- How does learning tool usage change over time?
- In how many courses is this tool both available and accessed at least once?
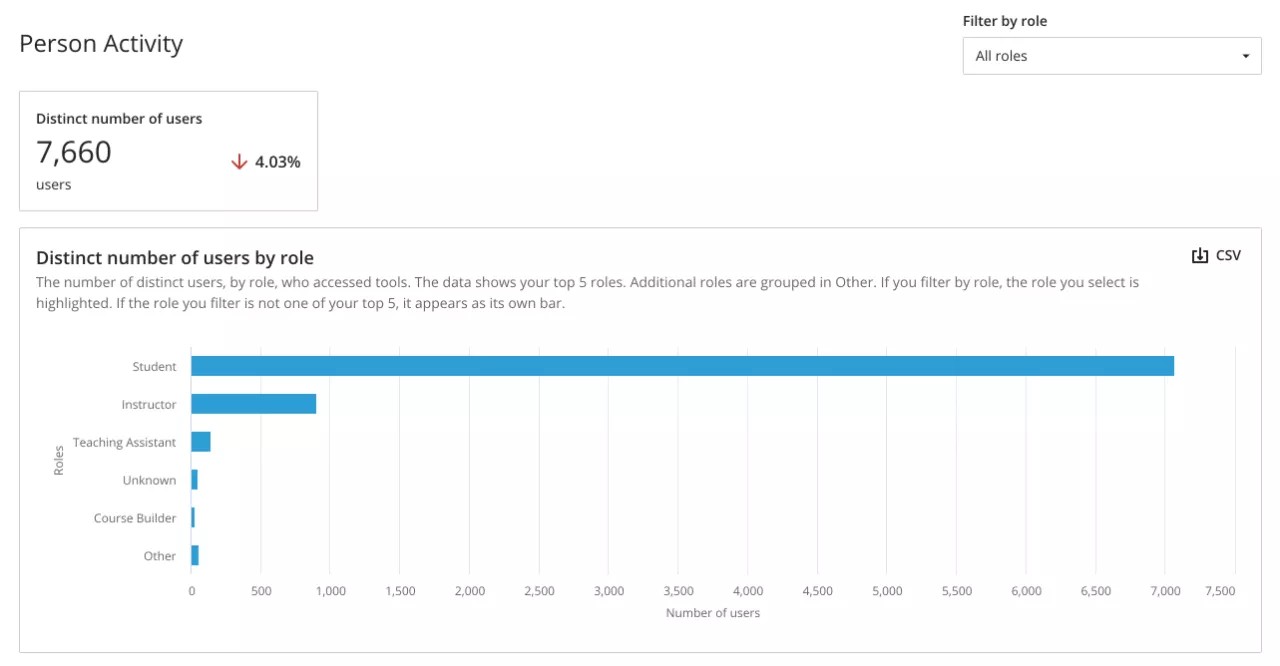
Local Filter by Role
Continuous Delivery | Release to Production 10 September 2020
New features, Reporting
This feature is only available to participants of the Blackboard Data Insider Program. For more information about the program & eligibility, please visit Blackboard Data Insider Program.
The Person Activity section of the Learning Tool Activity report now includes a local filter that allows users to filter down the visualizations from this section by a specific role.
In-app Product Feedback and New Features widget
Continuous Delivery | Release to Production 27 August 2020
New features
This feature is only available to participants of the Blackboard Data Insider Program. For more information about the program & eligibility, please visit Blackboard Data Insider Program.
As part of the Blackboard Data Insider Program, we are introducing a new channel to keep you updated on the latest features that we introduce during the Insider Program and hear what you have to say. The new "What's New" side panel will allow you to see the latest updates we share, react to them using the Emoji icons, and provide us with your feedback without having to leave the Blackboard Data UI.

New navigation sidebar
Continuous Delivery | Release to Production 27 August 2020
New features
A new navigation system has been introduced to provide a simpler experience when navigating the Blackboard Data User Interface, supported by the new collapsible left navigation bar.
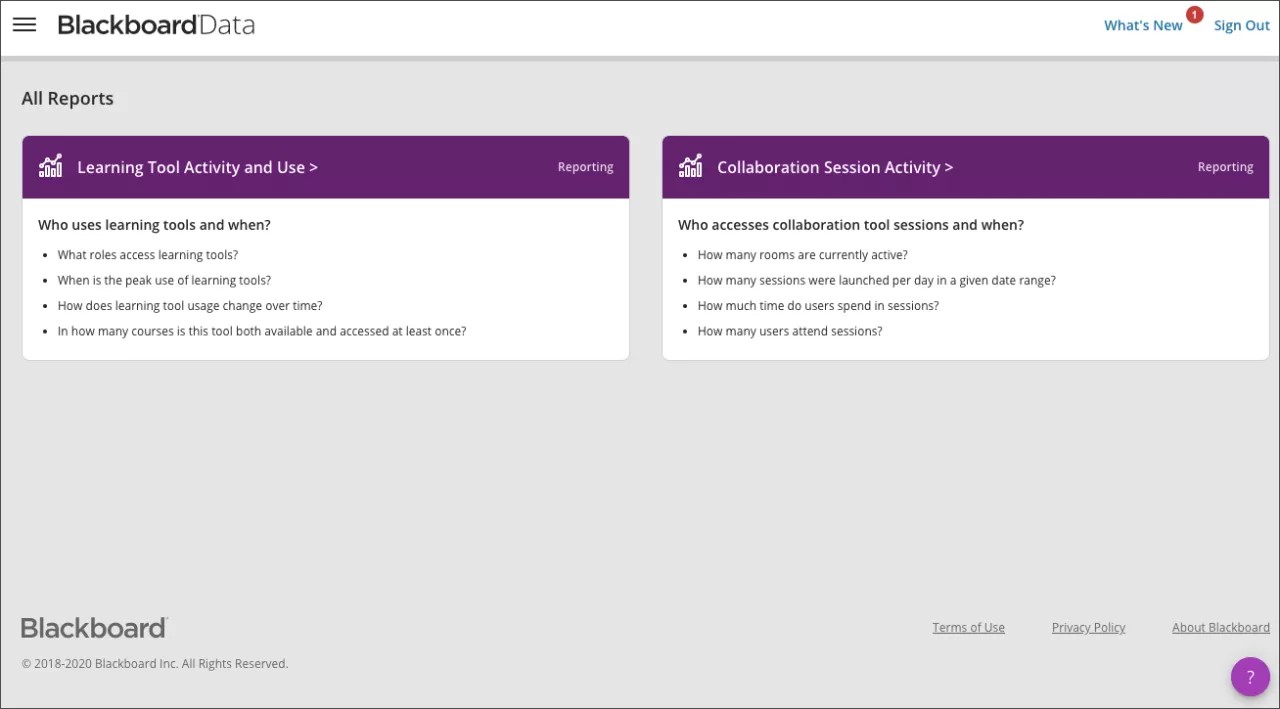
Reporting tab
Continuous Delivery BRS 1.0 | Release to Production 25 June 2020
New features, Reporting
This feature is only available to participants of the Blackboard Data Insider Program. For more information about the program & eligibility, please visit Blackboard Data Insider Program.
A new Reporting tab has been added to the Blackboard Data UI. This where users will see all the reports they have available and where we will be adding new reports in the future. This view includes the name of the report, as well as the primary and secondary questions the report helps answer.
Collaboration Session Activity report
Continuous Delivery | Release to Production 25 June 2020
New features, Reporting
This feature is only available to participants of the Blackboard Data Insider Program. For more information about the program & eligibility, please visit Blackboard Data Insider Program.
The new Collaboration Session Activity report allows users to see who accesses their collaboration tool sessions and when they are accessing them. The initial release of this report helps users understand:
- How many rooms are currently active?
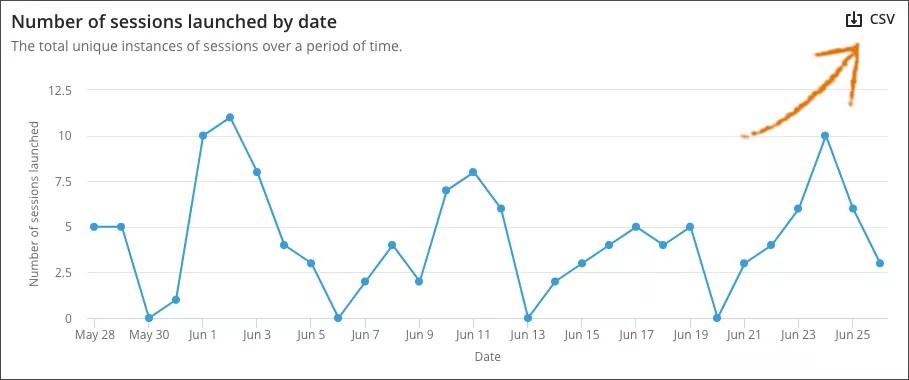
- How many sessions were launched per day in a given date range?
- How much time do users spend in sessions?
- How many users attend sessions?
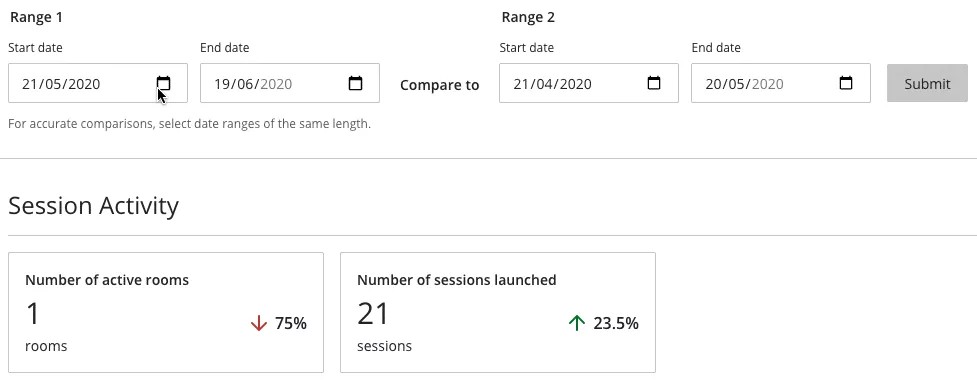
Date Filtering
- Range 1 is the main date range that is shown on the metrics and visualizations. Users can select any length starting with the same day.
- Range 2 is the comparative date range, used to compare with Range 1. The percentage changes on the numeric (Level 1) metrics are calculated by comparing Range 1 to Range 2.
- We recommend selecting date ranges of the same length for accurate comparisons.
Export to CSV
Users can export the data from the "Number of sessions launched by date" chart into CSV format for external consumption.